candlestick with rsi and macd

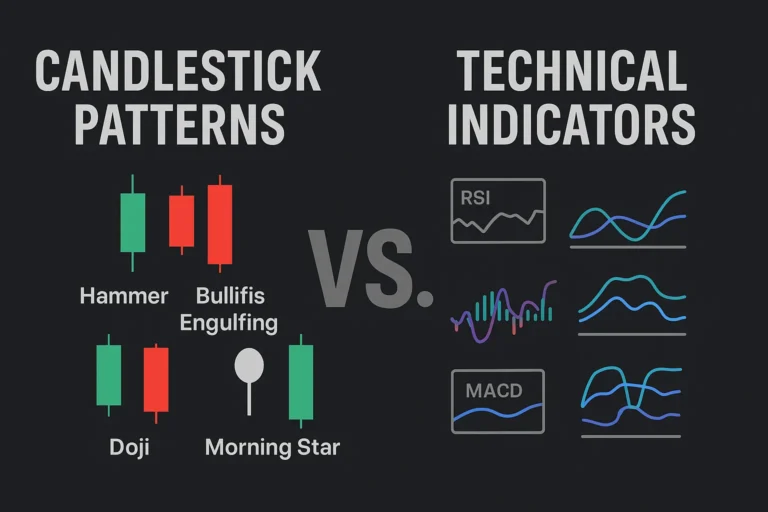
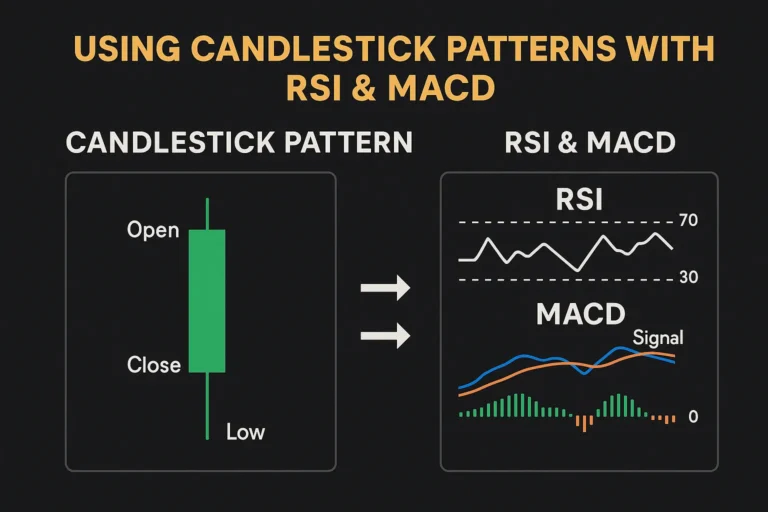
Using Candlestick Patterns with RSI & MACD for Accuracy

Candlestick patterns offer a clear view of market sentiment, but combining them with technical indicators like RSI and MACD can greatly increase your accuracy and confidence. Together, they form a powerful confluence that helps traders make better decisions. In this guide, you’ll learn how to effectively use candlestick patterns with RSI and MACD to boost…

candlestick vs indicators

Candlestick Patterns vs Technical Indicators: Which Is Better?

When it comes to trading analysis, two tools dominate the chart: candlestick patterns and technical indicators. Both offer valuable insights, but they do so in very different ways. So, which is better for traders — candlestick patterns or technical indicators? Let’s compare them side-by-side to help you make smarter trading decisions. What Are Candlestick Patterns?…

false candlestick signals

How to Avoid False Signals in Candlestick Patterns

Candlestick patterns are powerful, but they can also be misleading — especially when taken at face value without proper context. Many traders fall into the trap of acting too quickly on a pattern, only to face losses when the signal turns out to be false. In this guide, you’ll learn how to avoid false signals…

candlestick pattern psychology

Psychology Behind Candlestick Patterns: What Traders Miss

Candlestick patterns are more than just shapes on a chart — they represent the psychology of buyers and sellers battling in real time. Understanding this psychology helps traders look beyond the candle and truly interpret what the market is trying to say. In this article, we’ll break down the emotional forces behind popular candlestick patterns…

Combining Candlestick Patterns with Support & Resistance

Combining Candlestick Patterns with Support & Resistance

Candlestick patterns are powerful tools on their own, but when combined with support and resistance levels, their reliability skyrockets. This combo forms the foundation of many successful trading strategies across stocks, forex, and crypto markets. In this blog, we’ll break down how to use candlestick patterns more effectively by aligning them with key price levels….

candlestick pattern timeframes

Best Timeframes to Use Candlestick Patterns

Candlestick patterns work across all markets, but their effectiveness heavily depends on the timeframe you choose. A pattern that looks strong on a 1-minute chart might be noise, while the same setup on a daily chart could signal a high-probability trade. In this guide, we’ll explore the best timeframes to use candlestick patterns, how they…

three white soldiers pattern

Three White Soldiers & Three Black Crows Explained

Candlestick patterns are essential for spotting market direction shifts, but they’re also powerful in confirming strong trends. Two of the most reliable triple candlestick patterns are: Both patterns represent a clear shift in momentum and provide traders with high-confidence entries. What Is the Three White Soldiers Pattern? The Three White Soldiers pattern forms after a…

Evening Star Pattern: Spot Bearish Reversals

Evening Star Pattern: Spot Bearish Reversals

The Evening Star candlestick pattern is a powerful technical indicator that signals a potential bearish reversal after an uptrend. Recognizing this pattern can help traders exit long positions early or prepare for shorting opportunities. In this post, you’ll learn how to identify, interpret, and trade the Evening Star pattern like a pro. What Is the…

morning star pattern

Morning Star Pattern: A Bullish Reversal Guide

The Morning Star candlestick pattern is one of the most reliable bullish reversal patterns in technical analysis. It typically appears at the bottom of a downtrend and signals a potential trend reversal to the upside. In this guide, you’ll learn how to identify the Morning Star pattern, the psychology behind it, and how to trade…

tweezer tops and bottoms

Tweezer Tops and Bottoms: Reversal Signal Guide

The Tweezer Tops and Bottoms candlestick patterns are simple yet effective reversal signals that appear at the end of trends. Recognizing them early can help you spot potential market turning points before they fully unfold. In this guide, we’ll break down how these patterns form, what they signal, and how to trade them with precision….