Bullish Engulfing Pattern: How to Trade It
The Bullish Engulfing pattern is a popular and powerful candlestick signal that often indicates a trend reversal from bearish to bullish. It’s simple to spot and highly effective—especially when paired with trend context, support levels, or volume confirmation.
In this post, you’ll learn what the Bullish Engulfing pattern is, how it forms, and the best way to trade it successfully.
What Is a Bullish Engulfing Pattern?
The Bullish Engulfing pattern is a two-candle bullish reversal setup that appears after a downtrend or a corrective move.
Key Features:
- First candle is bearish (red) and small
- Second candle is bullish (green) and completely engulfs the body of the first candle
- The second candle opens below the first candle’s close and closes above its open
- Appears at support zones or after a down move
This pattern shows that buyers have overwhelmed sellers and are likely to push prices higher.
Bullish Engulfing Pattern Psychology
Here’s what’s happening behind the candles:
- The market is in a downtrend, and sellers seem to be in control
- A small bearish candle shows reduced momentum
- On the next day/session, buyers step in with strength
- They push the price above the entire range of the previous candle
- This “engulfing” move shows a shift in sentiment from bearish to bullish
Bullish Engulfing Pattern Example
Imagine a stock falling over several days. A small red candle forms on low volume. The next day, a large green candle opens lower, then rallies to close above the previous candle’s high.
This is a classic Bullish Engulfing pattern, suggesting that the bottom may be in place.
How to Trade the Bullish Engulfing Pattern
✅ Entry Strategy:
- Enter long after the bullish engulfing candle closes
- Conservative traders may wait for a pullback or break of recent resistance
✅ Stop Loss:
- Place SL below the low of the engulfing candle
- Keeps risk contained if the reversal fails
✅ Take Profit:
- Use previous resistance, Fibonacci levels, or moving averages as targets
- Maintain a minimum 1:2 risk-reward ratio
Best Conditions for Accuracy
- Appears after a downtrend or at the end of a pullback
- Forms near support zones or trendlines
- Confirmed with volume spike on the bullish candle
- RSI is rising from oversold levels
- Works best on 4H, daily, or weekly charts
Pro Tips for Trading Bullish Engulfing Patterns
- Use with indicators like RSI or MACD for added confirmation
- Avoid trading in sideways/ranging markets
- Combine with price structure for cleaner setups
- Use multiple timeframe analysis to validate signal strength
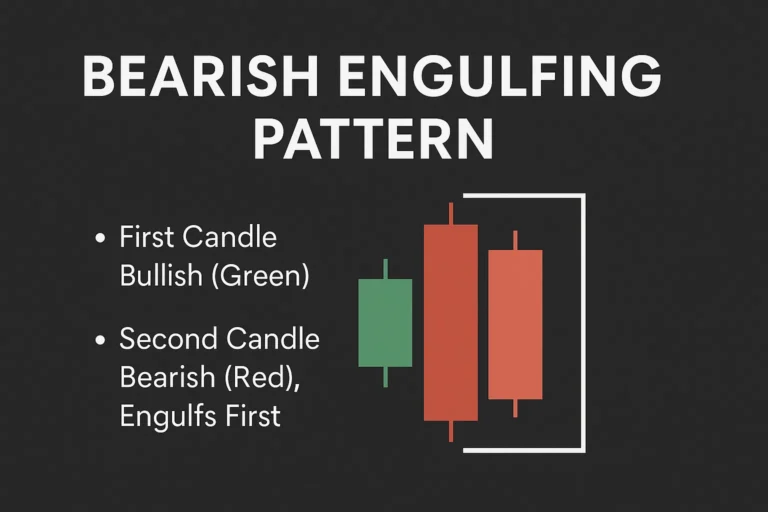
Bullish Engulfing vs Bearish Engulfing
| Feature | Bullish Engulfing | Bearish Engulfing |
|---|---|---|
| Appears After | Downtrend | Uptrend |
| Signal Type | Bullish Reversal | Bearish Reversal |
| Candle 1 | Small Red (Bearish) | Small Green (Bullish) |
| Candle 2 | Large Green (Engulfs) | Large Red (Engulfs) |
Conclusion
The Bullish Engulfing pattern is a reliable candlestick formation that signals a possible end to a downtrend. When traded with proper context—like key support levels and volume confirmation—it can offer excellent trade setups with favorable risk-reward ratios.
Add this pattern to your trading toolbox, and you’ll be better prepared to spot bullish reversals with confidence.
FAQs
1. Is the Bullish Engulfing pattern always accurate?
No pattern is 100% accurate. Confirm with support, volume, or indicators.
2. Can I use this pattern on intraday charts?
Yes, but it’s more reliable on 4H and daily timeframes.
3. What makes an engulfing candle valid?
The second candle must completely engulf the first candle’s real body (open to close).
4. Can it be red-green or green-green combo?
Ideally red-green. If both are green, the second candle must fully engulf the first.
5. Does volume matter?
Yes. Higher volume on the second candle increases reliability of the signal.