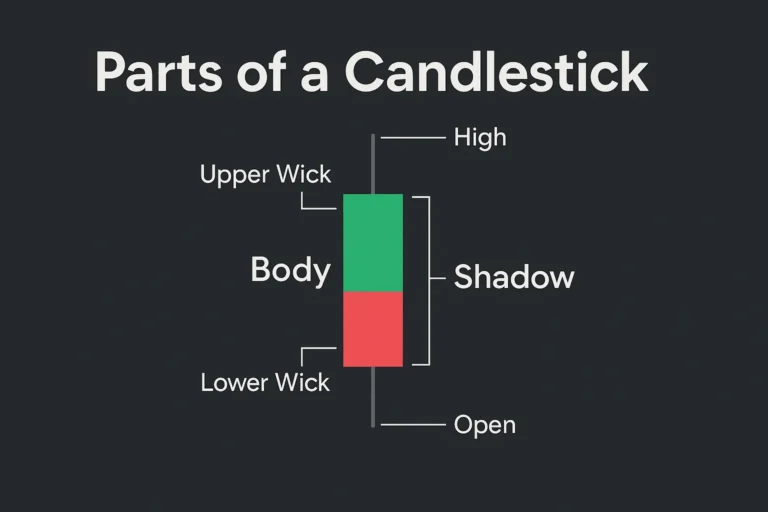
Bullish vs Bearish Candlestick Patterns
Candlestick patterns are essential tools in technical analysis, helping traders anticipate market movements. But to use them effectively, you must first understand the difference between bullish and bearish candlestick patterns.
In this beginner-friendly guide, we’ll explore what makes a pattern bullish or bearish, how to identify them, and when to use them for smarter trade entries.
What Are Bullish Candlestick Patterns?
Bullish candlestick patterns indicate that buyers are gaining control, and a price reversal or upward continuation is likely.
These patterns usually appear:
- At the bottom of a downtrend (reversal)
- During a pullback in an uptrend (continuation)
Common Bullish Candlestick Patterns:
- Hammer
- Bullish Engulfing
- Morning Star
- Doji at Support
- Three White Soldiers
What Are Bearish Candlestick Patterns?
Bearish candlestick patterns suggest that sellers are taking over, and a price decline or reversal may follow.
These patterns typically show up:
- At the top of an uptrend (reversal)
- During a relief rally in a downtrend (continuation)
Common Bearish Candlestick Patterns:
- Shooting Star
- Bearish Engulfing
- Evening Star
- Doji at Resistance
- Three Black Crows
Key Differences: Bullish vs Bearish Candlestick Patterns
| Feature | Bullish Patterns | Bearish Patterns |
|---|---|---|
| Market Sentiment | Optimistic (Buyers gain control) | Pessimistic (Sellers gain control) |
| Chart Position | Bottom of downtrend | Top of uptrend |
| Candle Colors | Green/White | Red/Black |
| Trade Direction | Buy (Long) | Sell (Short) |
| Signal Type | Reversal / Continuation | Reversal / Continuation |
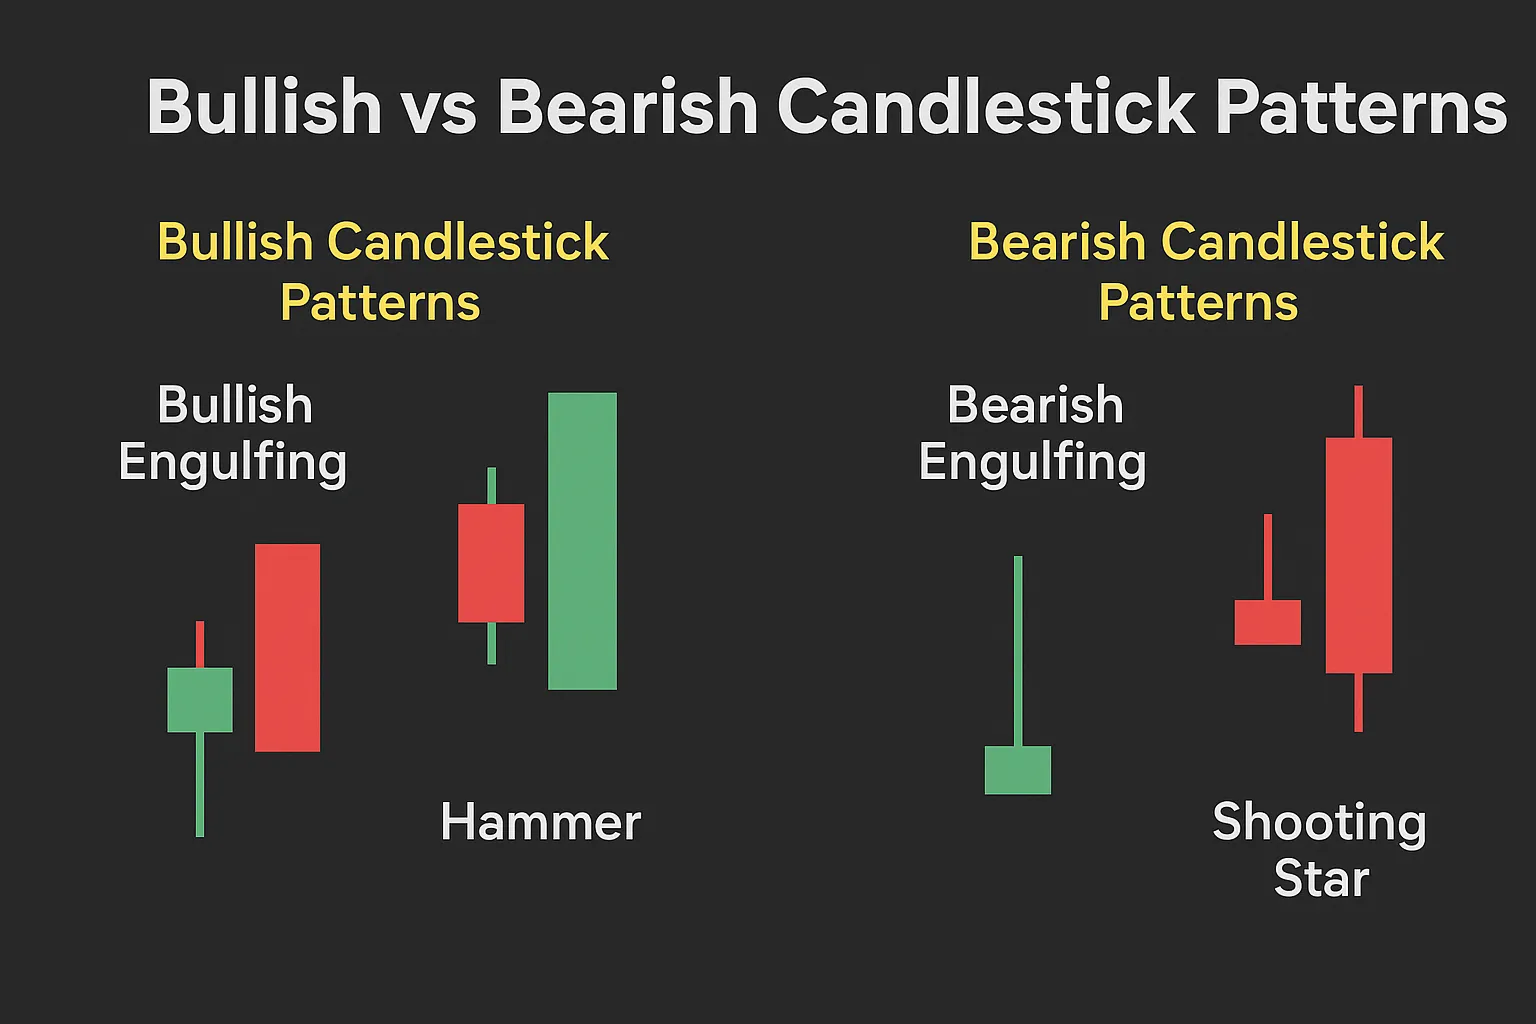
Visual Examples
- Bullish Engulfing: A small red candle followed by a large green candle that completely engulfs the first — strong buy signal.
- Bearish Engulfing: A small green candle followed by a large red candle — signals selling pressure and possible top.
- Hammer (Bullish): Long lower wick, small body at the top — buyers rejecting lower prices.
- Shooting Star (Bearish): Long upper wick, small body at the bottom — sellers rejecting higher prices.
When to Trust Bullish or Bearish Patterns
To improve accuracy, look for:
- Trend context: Use bullish patterns in downtrends; bearish ones in uptrends
- Support/resistance zones: Patterns near key levels are more reliable
- Volume confirmation: Heavier volume on confirmation candle boosts strength
- Indicator alignment: RSI, MACD, or trendlines can add confluence
Pro Tip: Combine With Confirmation
Don’t enter trades based on a pattern alone. Always:
- Wait for the next candle to confirm the move
- Check for price structure or breakout
- Manage risk with tight stop-losses
Conclusion
Knowing the difference between bullish and bearish candlestick patterns is foundational for successful technical trading. When used in context with trends, levels, and confirmation signals, these patterns can provide high-probability trade entries.
Mastering both sides of candlestick psychology—buyer vs. seller—is your key to consistent chart reading.
FAQs
1. Can the same pattern be bullish or bearish?
Yes. Context matters. A Doji at support is bullish, while at resistance it can be bearish.
2. Are bullish patterns better in uptrends?
Yes, especially during pullbacks. They support trend continuation.
3. Are candlestick patterns reliable for day trading?
Yes, but they’re more reliable on higher timeframes like 15-min, 1H, or daily.
4. Should I use indicators with candlestick patterns?
Absolutely. Indicators like RSI and MACD increase pattern reliability.
5. Do colors matter in candlestick charts?
Colors help visually interpret sentiment, but price structure is more important than color alone.