Combining Candlestick Patterns with Support & Resistance
Candlestick patterns are powerful tools on their own, but when combined with support and resistance levels, their reliability skyrockets. This combo forms the foundation of many successful trading strategies across stocks, forex, and crypto markets.
In this blog, we’ll break down how to use candlestick patterns more effectively by aligning them with key price levels.
What Are Support and Resistance Levels?
- Support is a price level where demand is strong enough to stop the price from falling further.
- Resistance is a level where selling pressure is likely to prevent the price from rising.
These levels act like psychological barriers in the market and often coincide with reversals or breakout zones.
Why Combine Candlesticks with Support & Resistance?
Candlestick patterns reflect short-term price sentiment, while support and resistance show longer-term structure. Together, they create high-probability trade setups.
🔍 Benefits:
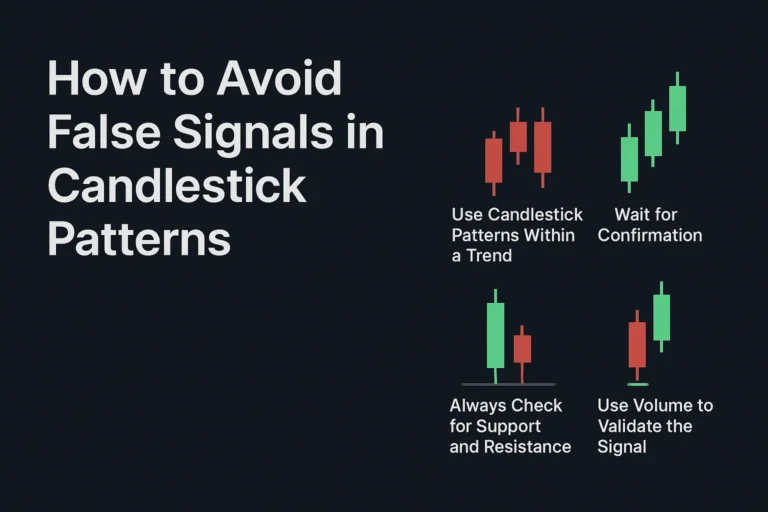
- Filters out false signals
- Confirms reversals or breakouts
- Enhances entry and exit timing
- Increases overall trade confidence
How to Use This Combination
1. Identify Key Support & Resistance Zones
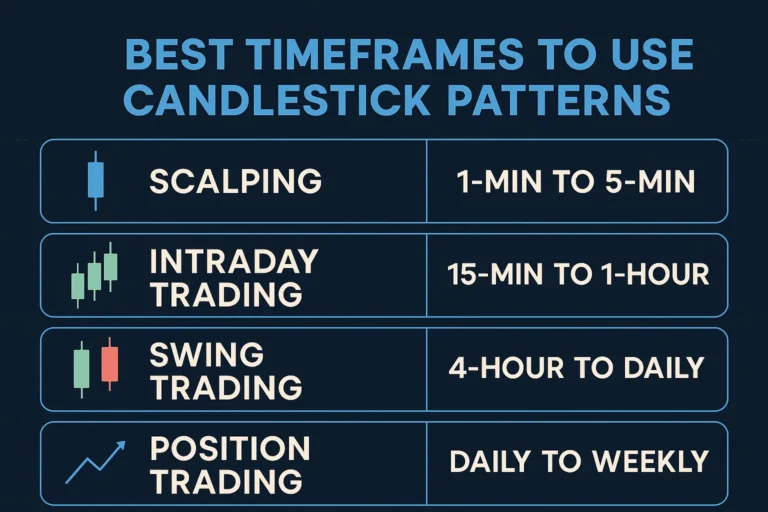
Start by marking recent swing highs, lows, round numbers, or horizontal congestion areas. Use daily or 4-hour charts for cleaner levels.
2. Wait for a Candlestick Pattern at the Level
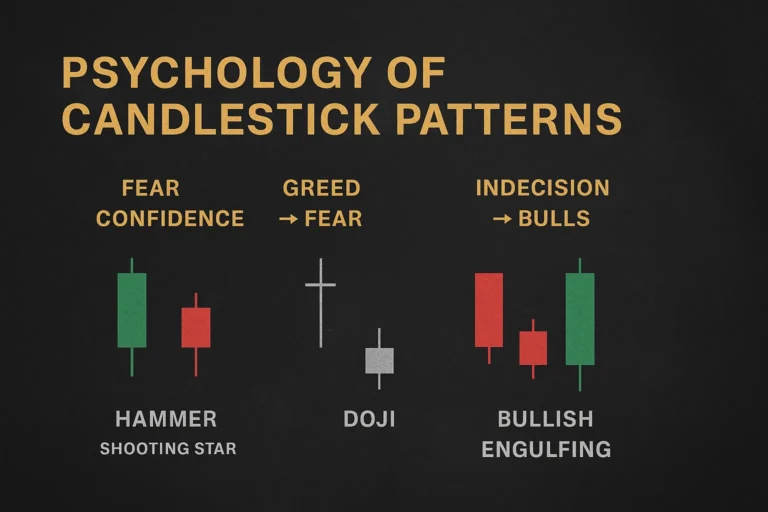
Look for bullish patterns like Hammer, Morning Star, Bullish Engulfing at support.
Look for bearish patterns like Shooting Star, Evening Star, Bearish Engulfing at resistance.
3. Confirm with Price Reaction
Watch for rejection wicks, a strong close away from the level, or increased volume. Confirmation boosts reliability.
4. Enter on Confirmation Candle or Retest
Some traders enter immediately after the pattern closes. Others wait for a minor retest of the level.
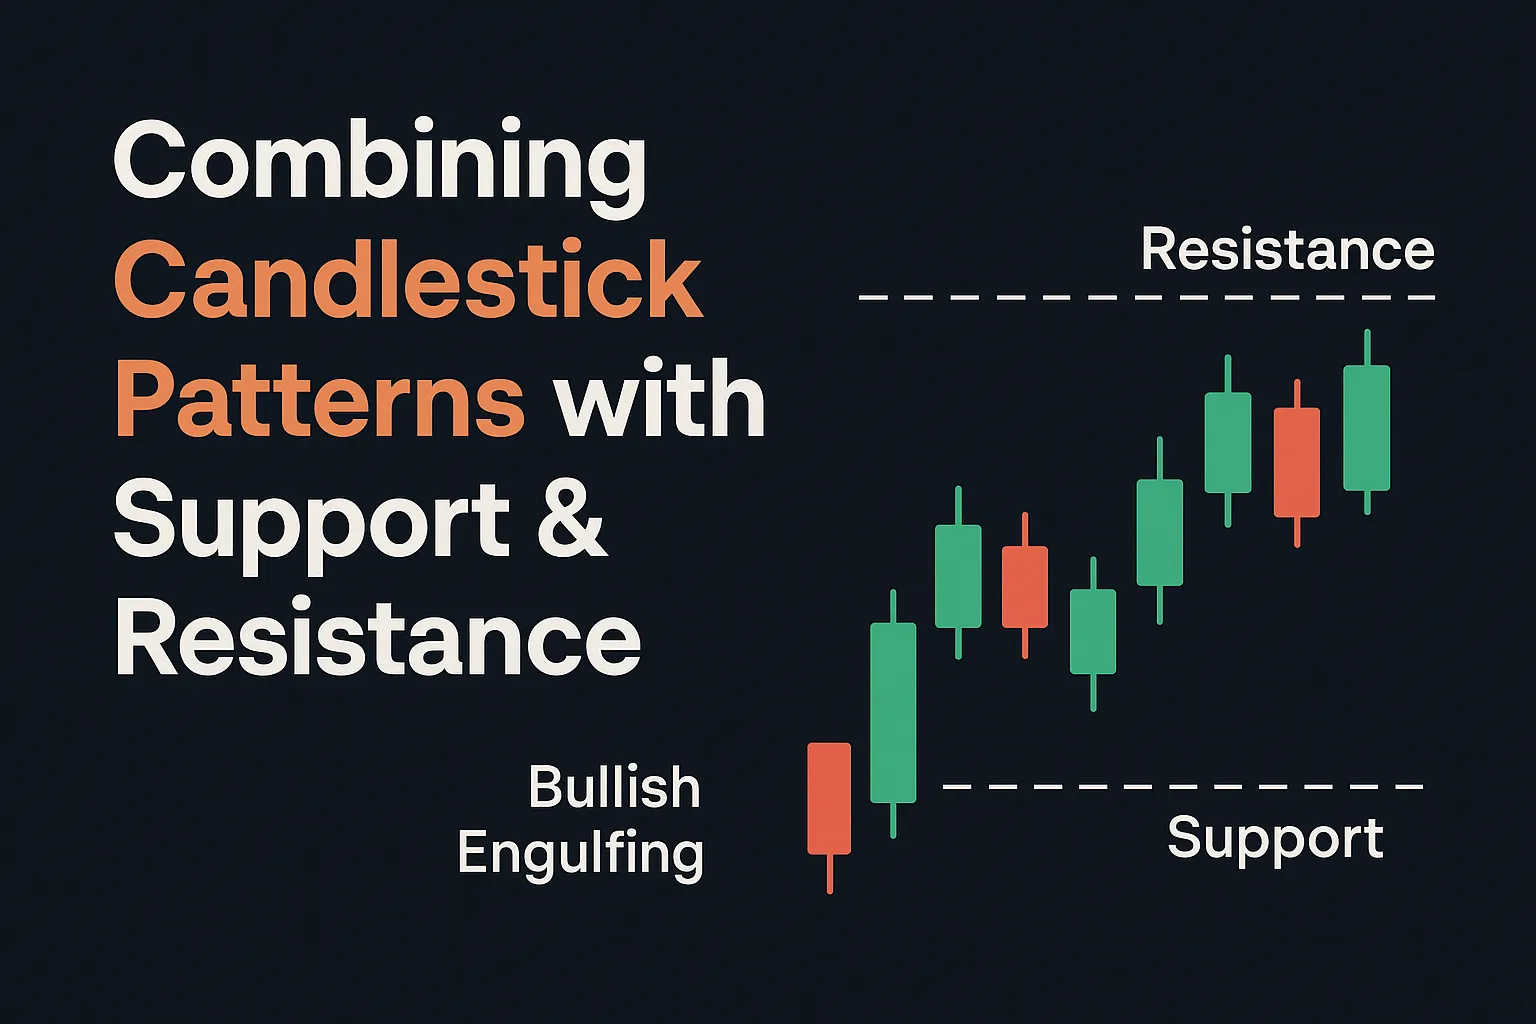
Example: Bullish Engulfing at Support
Imagine a stock is falling toward a known support zone. Suddenly, a bullish engulfing pattern forms on the daily chart. This indicates buyers are defending the support level.
Entry: After the engulfing candle closes
Stop-loss: Just below the support zone
Target: Next resistance level or 1:2 risk-reward
Common Pattern-Resistance/Support Pairings
| Candlestick Pattern | Appears At | Signal Type |
|---|---|---|
| Hammer | Support | Bullish reversal |
| Shooting Star | Resistance | Bearish reversal |
| Bullish Engulfing | Support | Reversal/Entry |
| Bearish Engulfing | Resistance | Reversal/Short |
| Doji / Spinning Top | Either | Indecision |
| Morning Star | Support | Strong reversal |
| Evening Star | Resistance | Strong reversal |
Tools to Draw Support and Resistance
- Horizontal Line Tool (in TradingView, MetaTrader, etc.)
- Pivot Points
- Fibonacci Retracement
- Price action zones (manual marking based on highs/lows)
Bonus Tip: Multi-Timeframe Alignment
For best results, draw support and resistance levels on higher timeframes (4H, Daily) and look for candlestick confirmations on lower timeframes (1H, 15-Min).
This method improves precision without sacrificing reliability.
Conclusion
Combining candlestick patterns with support and resistance levels turns a good strategy into a great one. You’re not just reacting to price, you’re trading based on structure and psychology—exactly how professional traders do it.
Master this combination, and your trade entries and exits will become sharper, more consistent, and more profitable.
FAQs
1. Do support and resistance work on all timeframes?
Yes, but higher timeframes give stronger levels. Intraday traders can fine-tune on lower timeframes.
2. Can I automate this strategy?
Partially. Some charting tools offer alerts when candlestick patterns appear near key levels.
3. What if a pattern appears between support and resistance?
Be cautious. These are lower-probability setups without nearby structure to anchor your trade.
4. Do false breakouts affect candlestick signals?
Yes. Always confirm breakouts with a strong candle close or a retest for safety.
5. Are support/resistance levels static?
No. They evolve with price action. Update them regularly based on new highs/lows.