Candlestick Patterns vs Technical Indicators: Which Is Better?
When it comes to trading analysis, two tools dominate the chart: candlestick patterns and technical indicators. Both offer valuable insights, but they do so in very different ways.
So, which is better for traders — candlestick patterns or technical indicators? Let’s compare them side-by-side to help you make smarter trading decisions.
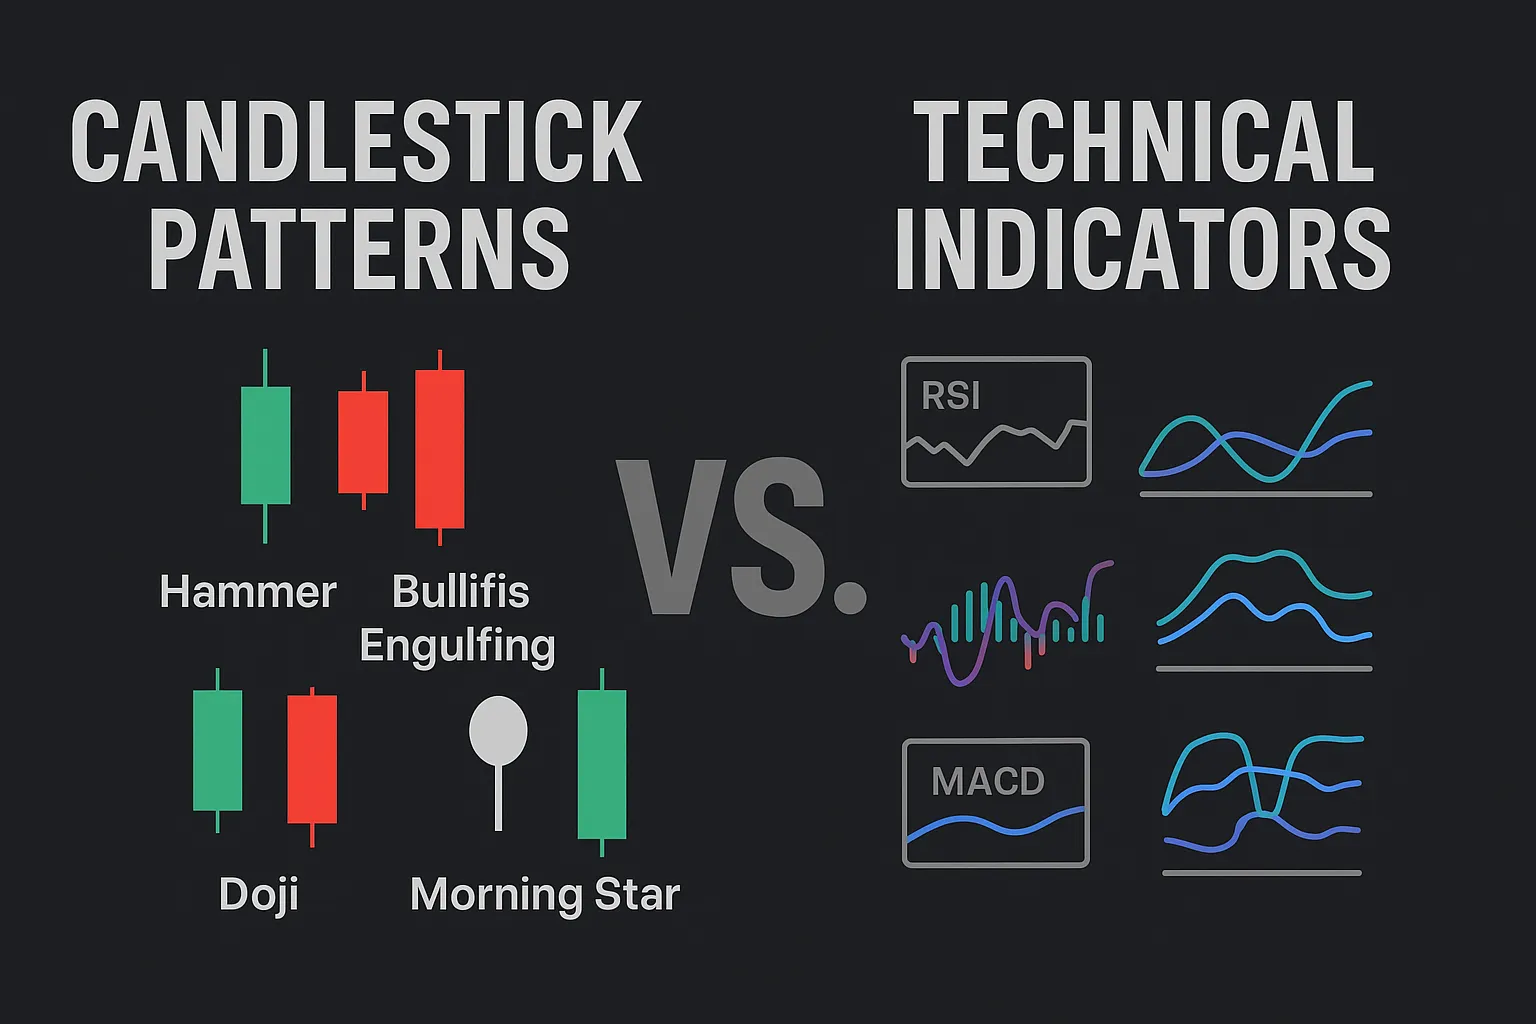
What Are Candlestick Patterns?
Candlestick patterns are visual price formations formed by one or more candlesticks on a chart. They reflect the battle between buyers and sellers during a specific time period.
Common examples include:
- Hammer
- Bullish/Bearish Engulfing
- Doji
- Morning/Evening Star
These patterns provide insight into market sentiment and momentum in real time.
What Are Technical Indicators?
Technical indicators are mathematical calculations based on price, volume, or open interest. They help traders identify:
- Trend direction
- Momentum strength
- Overbought/oversold conditions
- Volatility levels
Popular indicators include:
- RSI (Relative Strength Index)
- MACD (Moving Average Convergence Divergence)
- Moving Averages
- Bollinger Bands
Indicators are often lagging because they are based on past price data.
Key Differences: Candlesticks vs Indicators
| Feature | Candlestick Patterns | Technical Indicators |
|---|---|---|
| Type | Visual/Pattern-based | Mathematical/Formula-based |
| Speed | Real-time or leading | Lagging (mostly) |
| Use Case | Price behavior and sentiment | Trend, momentum, entry signals |
| Tools Needed | Just a chart | Requires indicator settings |
| Best For | Price action traders | Systematic/quant-based traders |
When to Use Candlestick Patterns
Use candlestick patterns when:
- You want to see price sentiment visually
- You’re trading near support or resistance zones
- You’re focused on price action and chart structure
- You need quick intraday insights without clutter
Example: A Bullish Engulfing pattern near a key support level can act as a high-probability long entry.
When to Use Technical Indicators
Use technical indicators when:
- You want to measure momentum or trend strength
- You rely on rules-based entries and exits
- You prefer using trading signals generated by formulas
- You’re analyzing longer-term trends
Example: The RSI dropping below 30 can help identify oversold conditions in a downtrend.
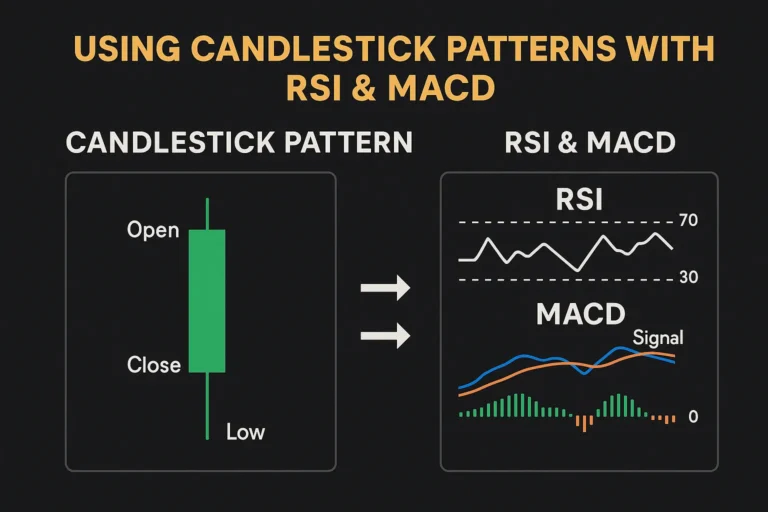
Can You Use Both Together?
Absolutely! The best trading strategies often combine candlestick patterns with indicators.
Example Combo:
- Bullish Engulfing pattern at support
- RSI confirms oversold
- MACD shows bullish crossover
This triple-confirmation approach increases your edge and accuracy.
Pros & Cons
✅ Candlestick Patterns
Pros:
- Easy to spot
- Real-time sentiment
- Great for reversals
Cons:
- Requires context and experience
- Can give false signals in choppy markets
✅ Technical Indicators
Pros:
- Quantifiable signals
- Easy to automate
- Useful for trend confirmation
Cons:
- Often lagging
- Can be confusing if overused
- Needs calibration per market
Conclusion: Which Is Better?
There’s no universal winner. The right tool depends on your trading style.
- If you prefer visual price action and simplicity → Start with candlestick patterns
- If you want signal-based systems and automation → Lean on technical indicators
- If you want the best of both worlds → Combine them for powerful confirmation
Ultimately, understanding the strengths and weaknesses of both will make you a smarter, more adaptable trader.
FAQs
1. Are candlestick patterns better for intraday trading?
Yes. They work well for quick price action analysis on lower timeframes.
2. Do indicators work in all markets?
Most indicators can be used across markets but need calibration for volatility.
3. Can candlestick patterns be automated?
Some platforms allow candlestick pattern detection, but it’s not as flexible as indicator-based bots.
4. Which indicator works best with candlestick patterns?
RSI, MACD, and Moving Averages are commonly used with candlestick setups.
5. Should beginners use indicators or candlesticks?
Start with candlestick basics, then explore indicators as you grow in experience.