read candlestick chart

How to Read a Candlestick Chart: Step-by-Step

Candlestick charts are one of the most powerful tools in technical analysis. Whether you’re trading stocks, forex, or crypto, understanding how to read candlestick charts can give you insights into market sentiment, price momentum, and potential reversals. In this guide, we’ll break down candlestick charts in a beginner-friendly way so you can start analyzing markets…

What Are Candlestick Patterns? A Beginner’s Guide

What Are Candlestick Patterns? A Beginner’s Guide

Candlestick patterns are among the most popular tools used in technical analysis. They help traders visually interpret price action and understand the ongoing battle between buyers and sellers. Whether you’re trading stocks, forex, or crypto, learning candlestick patterns is a foundational skill for smart decision-making. This beginner’s guide will help you understand what candlestick patterns…

parts of a candlestick

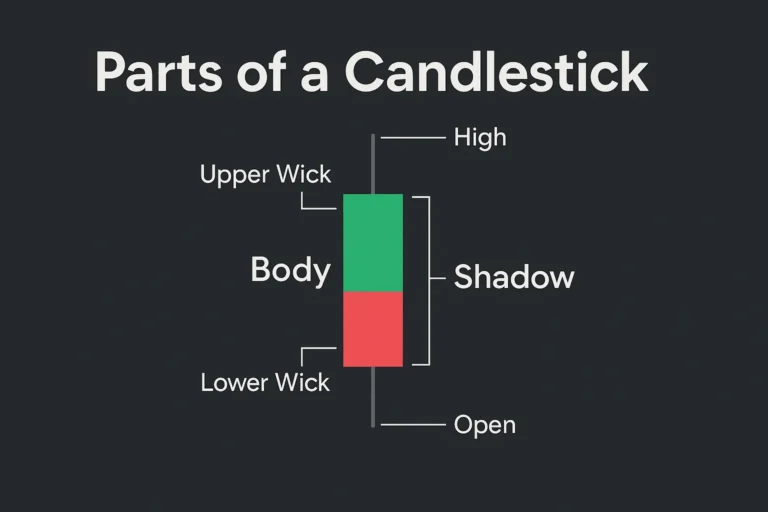
Parts of a Candlestick: Body, Wick, and Shadow

To master candlestick patterns, you first need to understand their basic structure. Each candlestick isn’t just a shape—it’s a story of price action told through three main parts: the body, wick, and shadow. In this beginner-friendly guide, we’ll break down the anatomy of a candlestick, what each part means, and how to interpret them correctly….

bullish vs bearish candlestick

Bullish vs Bearish Candlestick Patterns

Candlestick patterns are essential tools in technical analysis, helping traders anticipate market movements. But to use them effectively, you must first understand the difference between bullish and bearish candlestick patterns. In this beginner-friendly guide, we’ll explore what makes a pattern bullish or bearish, how to identify them, and when to use them for smarter trade…