candlestick pattern timeframes

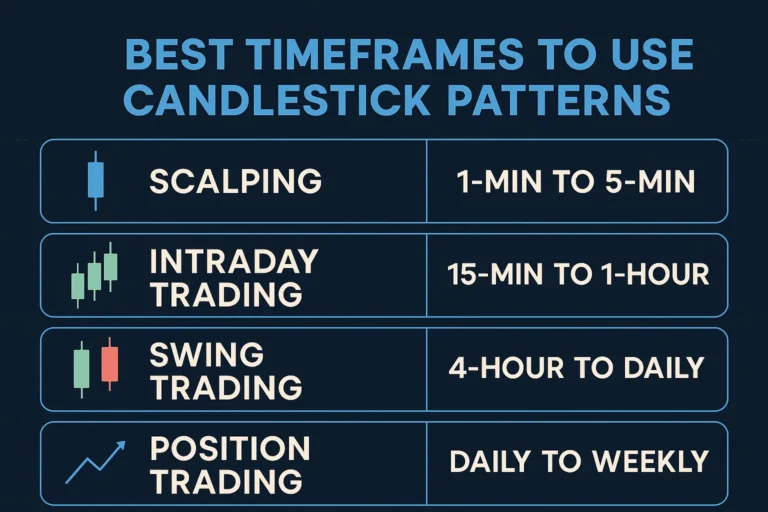
Best Timeframes to Use Candlestick Patterns

Candlestick patterns work across all markets, but their effectiveness heavily depends on the timeframe you choose. A pattern that looks strong on a 1-minute chart might be noise, while the same setup on a daily chart could signal a high-probability trade. In this guide, we’ll explore the best timeframes to use candlestick patterns, how they…

Combining Candlestick Patterns with Support & Resistance

Combining Candlestick Patterns with Support & Resistance

Candlestick patterns are powerful tools on their own, but when combined with support and resistance levels, their reliability skyrockets. This combo forms the foundation of many successful trading strategies across stocks, forex, and crypto markets. In this blog, we’ll break down how to use candlestick patterns more effectively by aligning them with key price levels….

candlestick pattern psychology

Psychology Behind Candlestick Patterns: What Traders Miss

Candlestick patterns are more than just shapes on a chart — they represent the psychology of buyers and sellers battling in real time. Understanding this psychology helps traders look beyond the candle and truly interpret what the market is trying to say. In this article, we’ll break down the emotional forces behind popular candlestick patterns…

false candlestick signals

How to Avoid False Signals in Candlestick Patterns

Candlestick patterns are powerful, but they can also be misleading — especially when taken at face value without proper context. Many traders fall into the trap of acting too quickly on a pattern, only to face losses when the signal turns out to be false. In this guide, you’ll learn how to avoid false signals…