Hammer Candlestick Pattern

Hammer Candlestick Pattern: Meaning, Setup, and Example

The Hammer candlestick pattern is a popular bullish reversal signal used by traders to spot potential bottoms after a price decline. It’s a single-candle formation that suggests a shift in momentum from sellers to buyers. In this guide, we’ll explain how to identify the Hammer pattern, its psychological meaning, and how to use it to…

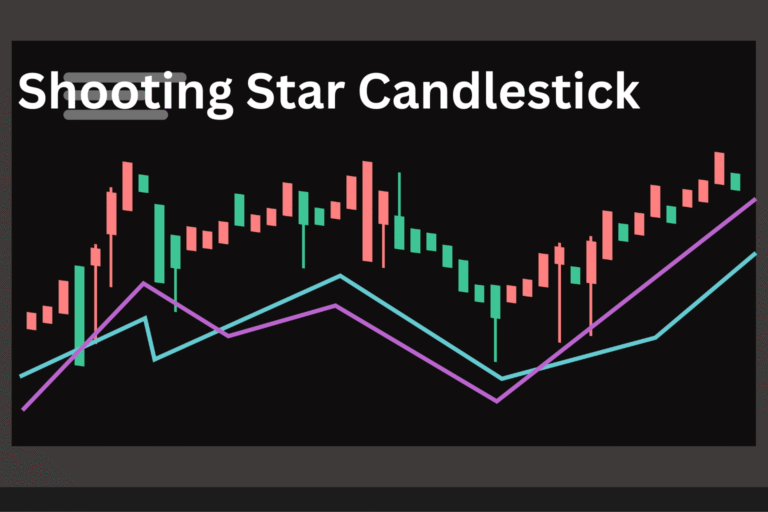
shooting star candlestick

Shooting Star Candlestick: How to Identify Trend Reversals

The Shooting Star candlestick is a powerful single-candle reversal pattern that often appears near the top of an uptrend. It signals that buyers may be losing momentum and a bearish reversal could be imminent. In this article, we’ll show you how to identify a Shooting Star candlestick, what it tells you about market sentiment, and…

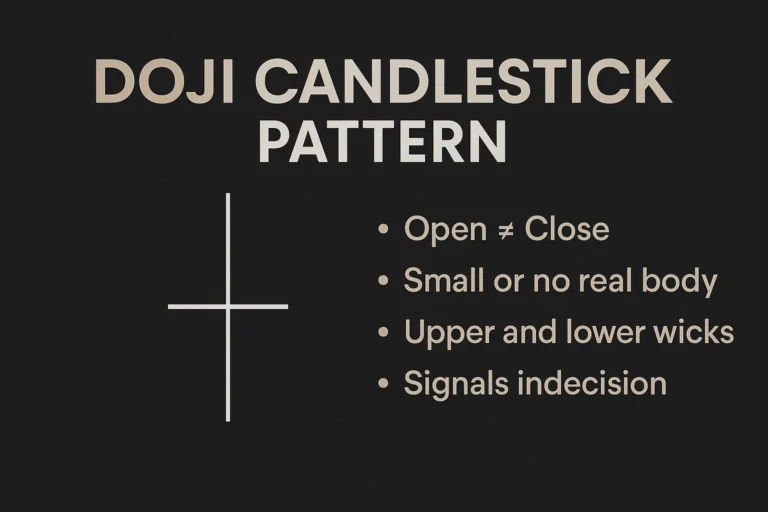
doji candlestick pattern

Doji Candlestick Pattern: What It Signals in Trading

The Doji candlestick pattern is one of the most important signals in technical analysis. It represents a moment of indecision in the market—when buyers and sellers are evenly matched and price closes very near to where it opened. Although simple in appearance, the Doji is powerful when used in the right context. In this guide,…

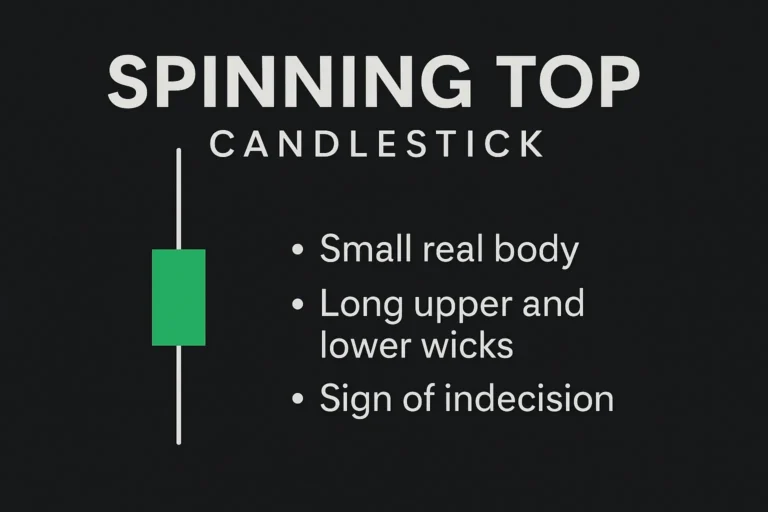
spinning top candlestick

Spinning Top Candlestick: Sign of Market Indecision

The Spinning Top candlestick pattern is a neutral formation that reflects market indecision. It can appear at the end of an uptrend, downtrend, or even in consolidation zones, often acting as a pause signal for traders watching momentum shifts. In this guide, you’ll learn how to identify the Spinning Top candlestick, what it tells you…