Doji Candlestick Pattern: What It Signals in Trading
The Doji candlestick pattern is one of the most important signals in technical analysis. It represents a moment of indecision in the market—when buyers and sellers are evenly matched and price closes very near to where it opened.
Although simple in appearance, the Doji is powerful when used in the right context. In this guide, you’ll learn what a Doji pattern is, how to identify it, and what it means for traders.
What Is a Doji Candlestick?
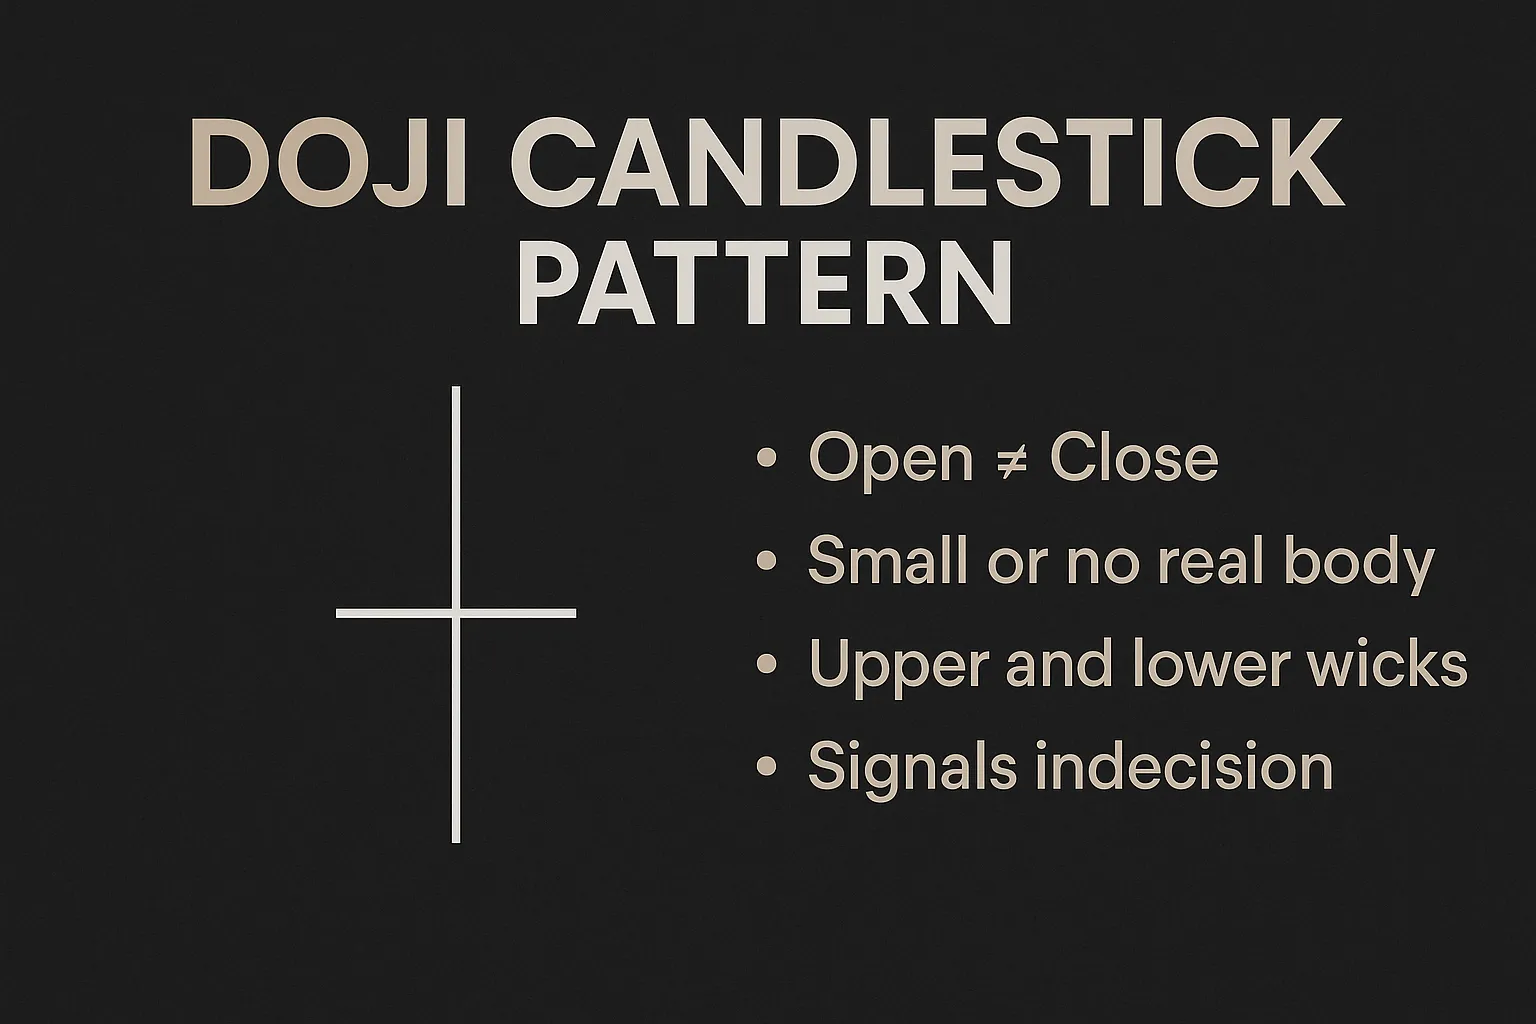
A Doji is a candlestick that forms when the opening and closing prices are nearly equal. This results in a very small or nonexistent body, with upper and/or lower wicks extending from it.
The shape looks like a plus sign, cross, or inverted “T”, depending on price movement during the session.
Key Characteristics of a Doji
- Open ≈ Close
- Small or no real body
- Can have long or short upper and lower wicks
- Reflects market indecision or equilibrium
A Doji does not confirm a trend reversal by itself but often signals a pause or a potential turning point, especially near key levels.
Types of Doji Candlesticks
1. Standard Doji
- Equal open and close
- Small or no wicks
- Neutral candle
2. Long-Legged Doji
- Long upper and lower wicks
- Shows high volatility and strong indecision
3. Dragonfly Doji
- No upper wick, long lower wick
- Bullish reversal signal at support
4. Gravestone Doji
- No lower wick, long upper wick
- Bearish reversal signal at resistance
What the Doji Tells Traders
The Doji shows that neither bulls nor bears could maintain control. Price opened, moved up/down, and then returned to near its starting point.
Interpretation:
- In an uptrend: A Doji may signal that bullish momentum is weakening
- In a downtrend: It could mean that selling pressure is fading
- In sideways markets: It confirms indecision or range-bound action
A Doji near support or resistance often suggests a potential trend reversal.
How to Trade the Doji Pattern
✅ Don’t trade the Doji alone.
Wait for confirmation with the next candle:
- Bullish Confirmation: A strong green candle after a Doji near support
- Bearish Confirmation: A strong red candle after a Doji near resistance
✅ Combine with:
- Support and resistance levels
- Trendlines or moving averages
- Indicators like RSI or MACD
✅ Example Trade Setup:
- Doji appears near a support zone
- RSI shows oversold
- Next candle is a bullish engulfing
- ✅ Go long with SL below the Doji’s low
Common Mistakes to Avoid
- Assuming every Doji means a reversal
- Trading without confirmation
- Ignoring the broader trend
- Relying on Doji in low-volume markets
Conclusion
The Doji candlestick pattern is a valuable signal of market indecision. It’s not a trade signal on its own, but when used with confirmation and key levels, it can help traders anticipate reversals, pauses, or breakouts.
Learning how to read Doji candles in context will elevate your ability to analyze charts with clarity and precision.
FAQs
1. Is a Doji always a reversal pattern?
No. It signals indecision. A reversal may follow, but only with confirmation.
2. What’s the best timeframe for using Doji patterns?
4-hour and daily charts provide more reliable signals than 1-minute or 5-minute charts.
3. Can a Doji be bullish or bearish?
By itself, it’s neutral. But context and follow-up candles determine its meaning.
4. How do I confirm a Doji signal?
Use the next candle’s direction, volume, and support/resistance levels.
5. Is the Doji pattern useful in crypto and forex?
Yes. It works well across all asset classes, including crypto, stocks, and forex.