Hammer Candlestick Pattern: Meaning, Setup, and Example
The Hammer candlestick pattern is a popular bullish reversal signal used by traders to spot potential bottoms after a price decline. It’s a single-candle formation that suggests a shift in momentum from sellers to buyers.
In this guide, we’ll explain how to identify the Hammer pattern, its psychological meaning, and how to use it to time trade entries more effectively.
What Is a Hammer Candlestick Pattern?
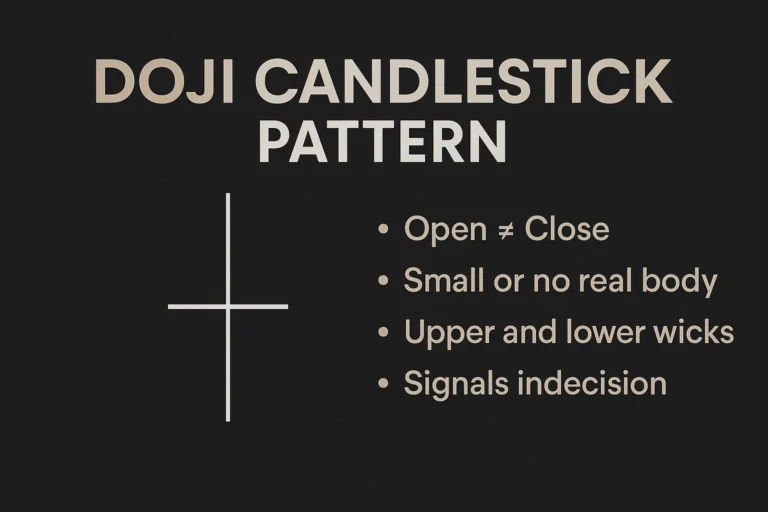
A Hammer is a single bullish reversal candlestick that appears after a downtrend. It has a small real body near the top of the candle and a long lower wick, which shows that sellers were initially in control but lost power as buyers took over before the candle closed.
Key Features:
- Appears after a downtrend
- Small body near the top of the candle
- Long lower shadow, at least 2x the size of the body
- Little or no upper wick
- Can be green or red, but green adds more strength
The Hammer reflects buyer rejection of lower prices, hinting at a potential trend reversal.
Hammer vs Inverted Hammer
| Feature | Hammer | Inverted Hammer |
|---|---|---|
| Shape | Long lower wick | Long upper wick |
| Appears After | Downtrend | Downtrend |
| Signal | Bullish reversal | Possible reversal, needs strong confirmation |
What the Hammer Pattern Tells Traders
The Hammer shows that sellers pushed prices lower during the session, but buyers stepped in aggressively, closing the price near the high. This sudden shift signals that bearish momentum is weakening—and a bullish reversal might follow.
It’s especially effective when it appears near support zones, trendlines, or oversold indicators.
How to Identify a Hammer Candlestick
- Must appear after a downward move
- Lower wick is at least 2x longer than the body
- Body is located at the upper end of the price range
- Little or no upper wick
- Works better on 4H, Daily, or Weekly charts
How to Trade the Hammer Pattern
✅ Entry Strategy:
- Enter long after a bullish confirmation candle follows the Hammer
- Look for a green candle that breaks above the high of the Hammer
✅ Stop Loss:
- Place SL below the low of the Hammer
- This protects against false breakouts or extended downtrends
✅ Target:
- Nearby resistance levels or use a 1:2 risk-reward ratio
- Use a trailing stop if part of a larger reversal
Ideal Conditions for the Hammer Pattern
- Appears at or near support levels
- Confirmed by increased volume
- RSI is below 30 (oversold zone)
- Divergence with MACD or other oscillators
Example Scenario
Let’s say a stock has been in a downtrend for several days. It forms a red candle with a long lower wick and closes near the top of the candle range. The next day, a strong green candle appears and breaks above the high of the Hammer.
→ This setup suggests buyers have regained control and a bullish trend may follow.
Common Mistakes to Avoid
- Trading a Hammer without confirmation
- Ignoring the overall trend or market structure
- Misidentifying candles with small wicks or bodies
- Using it in sideways markets without momentum
Conclusion
The Hammer candlestick pattern is a reliable tool for spotting potential bullish reversals. While it’s simple in appearance, it carries strong psychological meaning—buyers overpowering sellers at the bottom of a move.
Used with context, confirmation, and risk control, the Hammer can be a powerful entry trigger in both short- and long-term trading strategies.
FAQs
1. Does the Hammer pattern always mean a reversal?
Not always. It needs confirmation with the next bullish candle and context from nearby support.
2. Is a green Hammer stronger than a red one?
Yes. A green Hammer suggests stronger buying pressure during the candle.
3. Can the Hammer be used in crypto or forex markets?
Yes. It works across all liquid markets including stocks, forex, crypto, and indices.
4. What timeframe works best for the Hammer?
Daily and 4-hour timeframes offer higher reliability than short intraday charts.
5. How can I confirm the Hammer signal?
Look for bullish volume, RSI oversold conditions, or a strong follow-up green candle.