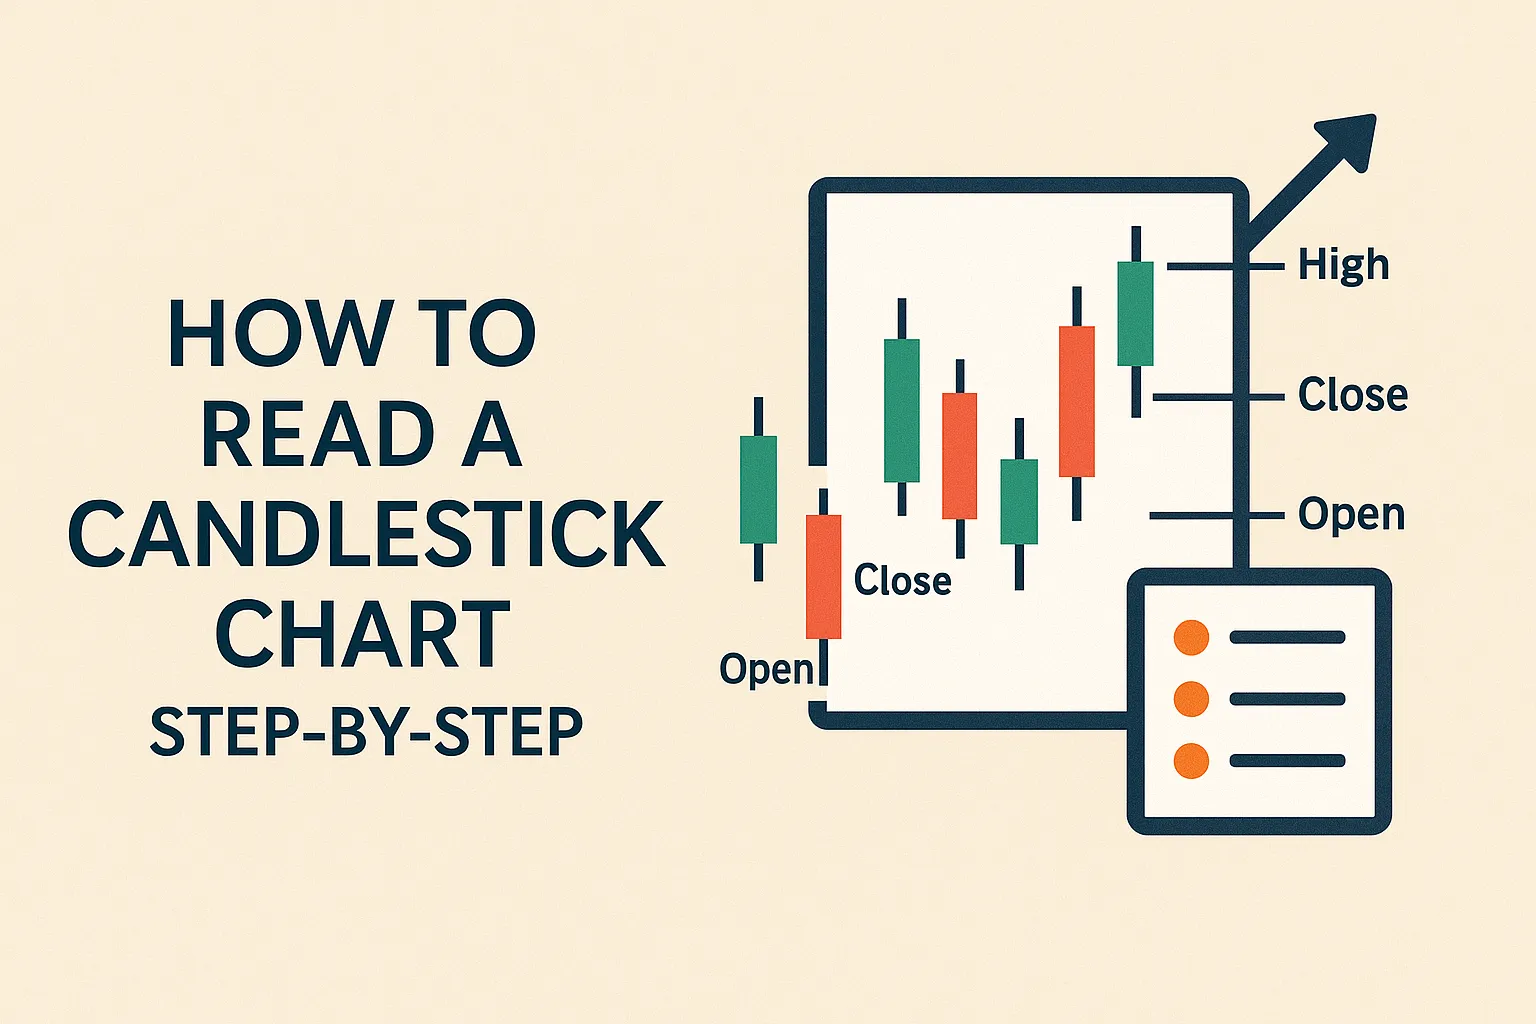
How to Read a Candlestick Chart: Step-by-Step
Candlestick charts are one of the most powerful tools in technical analysis. Whether you’re trading stocks, forex, or crypto, understanding how to read candlestick charts can give you insights into market sentiment, price momentum, and potential reversals.
In this guide, we’ll break down candlestick charts in a beginner-friendly way so you can start analyzing markets with confidence.
What Is a Candlestick Chart?
A candlestick chart is a type of price chart that shows the high, low, open, and close prices for a given time period. Each candlestick represents a specific time interval (like 5 minutes, 1 hour, or 1 day) and visually displays how price moved during that time.
Candlestick charts help traders see patterns and trends at a glance.
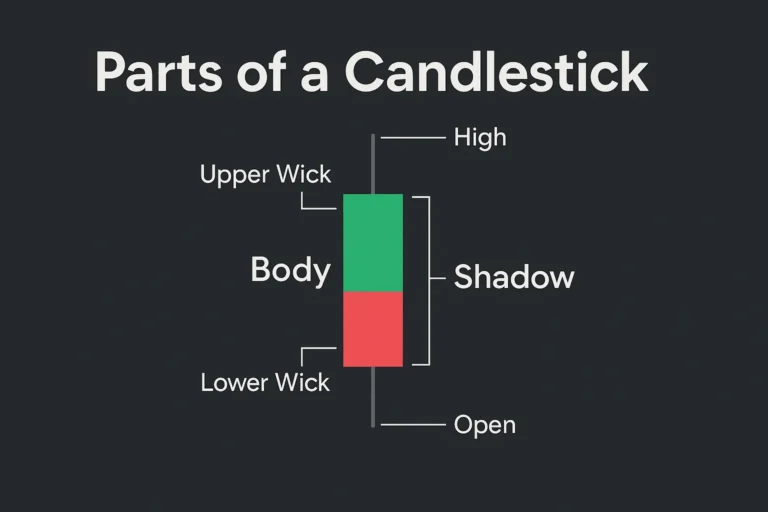
Anatomy of a Candlestick
Each candlestick has four key components:
- Open: The price at the start of the time period
- Close: The price at the end of the time period
- High: The highest price reached during the period
- Low: The lowest price reached during the period
Candlestick Structure:
- Body: The area between the open and close prices
- Wick (or Shadow): The line above and below the body, showing the high and low
- Color: Indicates price direction
- Green/White (Bullish): Close > Open
- Red/Black (Bearish): Close < Open
Step-by-Step: How to Read a Candlestick
Step 1: Identify the Timeframe
First, decide what timeframe you are analyzing (1-minute, 1-hour, daily, etc.). Each candle will represent that duration.
Example: A daily chart means each candlestick shows one day of price action.
Step 2: Observe the Candlestick Color
- Green/Bullish Candle: Price closed higher than it opened
- Red/Bearish Candle: Price closed lower than it opened
This tells you who was in control: buyers or sellers.
Step 3: Examine the Size of the Body
- Long Body: Strong buying or selling pressure
- Short Body: Low price movement or indecision
Body size reveals the strength of market participants.
Step 4: Check the Wick Lengths
- Long Upper Wick: Rejection at higher prices (potential resistance)
- Long Lower Wick: Rejection at lower prices (potential support)
- Small or No Wick: More decisive trend movement
Wicks often hint at possible reversals or failed breakouts.
Step 5: Look for Context and Patterns
Reading a single candlestick gives limited insight. Look at the sequence of candles to identify common patterns like:
- Doji (Indecision)
- Engulfing (Reversals)
- Hammer/Shooting Star (Trend signals)
Context is key—combine candlestick signals with support, resistance, and volume.
Real-Life Example
Let’s say you’re looking at a daily chart of a stock. You spot a long lower wick with a small body near the top of the candle—this is a Hammer, a bullish reversal pattern often seen at the bottom of a downtrend.
This tells you that buyers stepped in after sellers pushed the price down, indicating potential upside ahead.
Tips for Beginners
- Start with larger timeframes (daily or weekly) for clear signals
- Use candlestick charts alongside moving averages or RSI
- Practice reading charts before placing real trades
- Look at candles in groups rather than individually
Conclusion
Learning to read candlestick charts is a foundational skill for any trader. By observing candle structure, color, size, and patterns, you can interpret market sentiment and spot trade setups with confidence.
As you grow familiar with candlesticks, they’ll become a natural part of your trading strategy.
FAQs
1. What does a green candlestick mean?
It means the price closed higher than it opened during the selected time period—bullish signal.
2. Are candlestick charts better than bar charts?
Yes, for many traders, candlestick charts are easier to interpret visually and reveal more about price psychology.
3. What does a long wick indicate?
It shows price rejection. A long upper wick suggests selling pressure; a long lower wick shows buying interest.
4. Which timeframes are best for reading candlestick charts?
Beginners should start with daily charts. Intraday traders often use 5-min to 15-min charts.
5. Can I use candlestick charts for crypto trading?
Yes. Candlestick patterns work across all financial markets—stocks, forex, and cryptocurrencies.