Morning Star Pattern: A Bullish Reversal Guide
The Morning Star candlestick pattern is one of the most reliable bullish reversal patterns in technical analysis. It typically appears at the bottom of a downtrend and signals a potential trend reversal to the upside.
In this guide, you’ll learn how to identify the Morning Star pattern, the psychology behind it, and how to trade it with confidence.
What Is the Morning Star Pattern?
The Morning Star is a three-candle formation that indicates a shift from bearish momentum to bullish sentiment. It represents a pause in selling pressure, followed by strong buying action.
This pattern is most effective when it appears after a sustained downtrend and is confirmed with high trading volume.
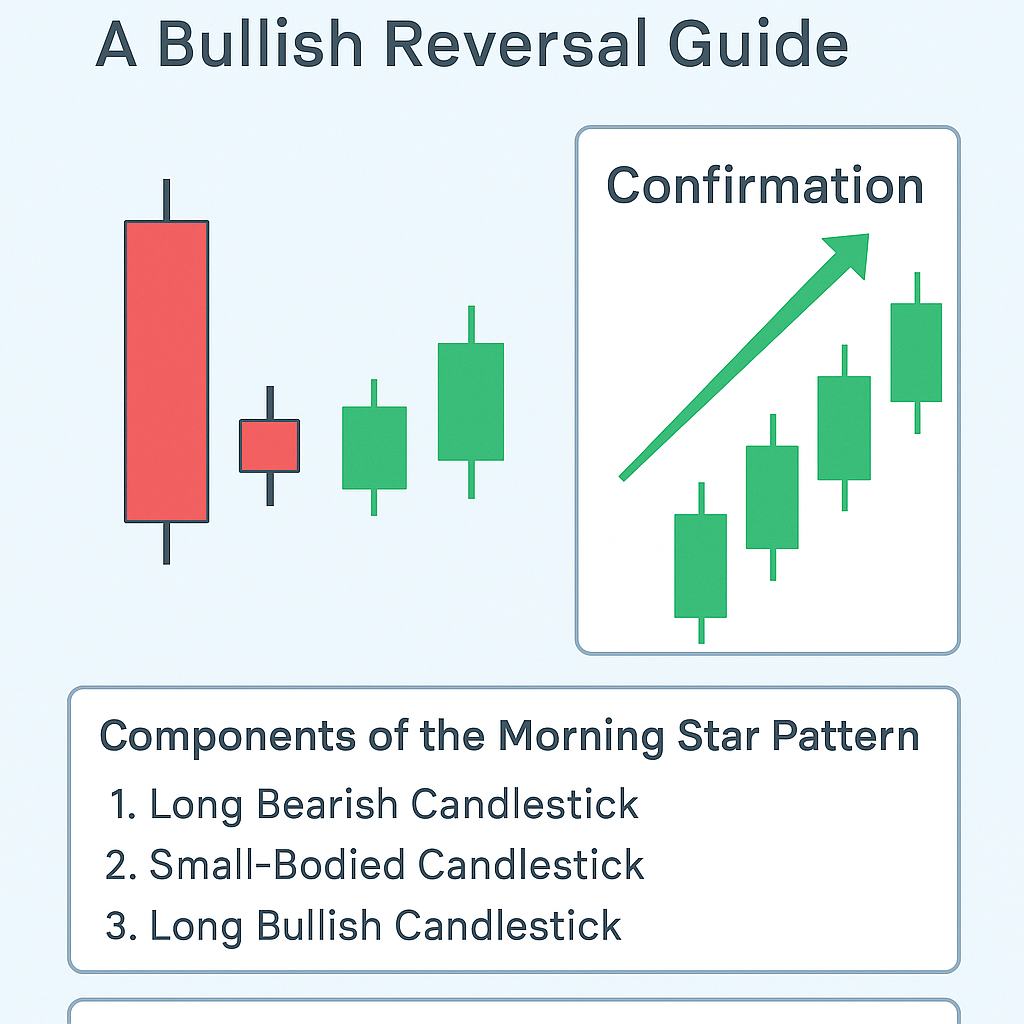
Components of the Morning Star Pattern
A valid Morning Star pattern consists of three candles:
- First Candle: A long bearish (red) candlestick, showing strong selling pressure.
- Second Candle: A small-bodied candle (can be bullish or bearish), indicating indecision. This can be a Doji or a spinning top.
- Third Candle: A long bullish (green) candlestick that closes well into the body of the first candle, confirming the reversal.
The second candle should gap down slightly from the first, and the third candle should ideally close above the midpoint of the first candle.
Morning Star Chart Example
Imagine a stock falling over several days. Then:
- Day 1: Strong red candle – bears are in control
- Day 2: A small indecisive candle – momentum is slowing
- Day 3: A big green candle – buyers step in and reverse the trend
This sequence creates the classic Morning Star pattern.
Why It’s Called a “Morning Star”
The name “Morning Star” comes from astronomy, where the morning star (Venus) appears in the sky before sunrise—symbolizing the dawn of a new trend in the market.
Psychology Behind the Pattern
The Morning Star reflects a change in market sentiment:
- The first bearish candle shows continued selling
- The second candle reflects hesitation and uncertainty
- The third bullish candle confirms that buyers have gained control
This psychological shift from fear to confidence is what makes the pattern so powerful.
How to Trade the Morning Star Pattern
✅ Entry Point:
Enter a long trade at the close of the third candle or the open of the next candle, confirming the pattern.
✅ Stop Loss:
Place the stop loss below the low of the second (indecision) candle to manage risk.
✅ Profit Target:
Use nearby resistance levels, Fibonacci retracement, or a risk-reward ratio (like 1:2) to define your exit.
Best Practices
- Look for the pattern after a clear downtrend
- Confirm with volume—higher volume on the third candle strengthens the signal
- Use with other tools like RSI, MACD, or support levels
- Avoid trading Morning Stars in a ranging market
Common Mistakes to Avoid
- Trading the pattern in isolation without confirmation
- Ignoring the volume and trend context
- Confusing it with other three-candle setups like the Evening Star
Conclusion
The Morning Star pattern is a powerful signal that a downtrend may be ending and a bullish move could begin. When identified in the right context and confirmed with volume or indicators, it becomes a highly reliable trading setup.
If you’re serious about learning candlestick patterns, mastering the Morning Star should be one of your top priorities.
FAQs
1. Is the Morning Star pattern always accurate?
No pattern is 100% accurate. Combine it with volume and indicators for better results.
2. What timeframes work best for the Morning Star?
Daily and 4-hour charts offer stronger signals, but it can be used on any timeframe.
3. Can Morning Star be used in crypto or forex?
Yes, the pattern is universal and works across markets like stocks, forex, and crypto.
4. How is Morning Star different from a Doji reversal?
The Morning Star includes three candles and is more structured, while a Doji reversal can be one or two candles.
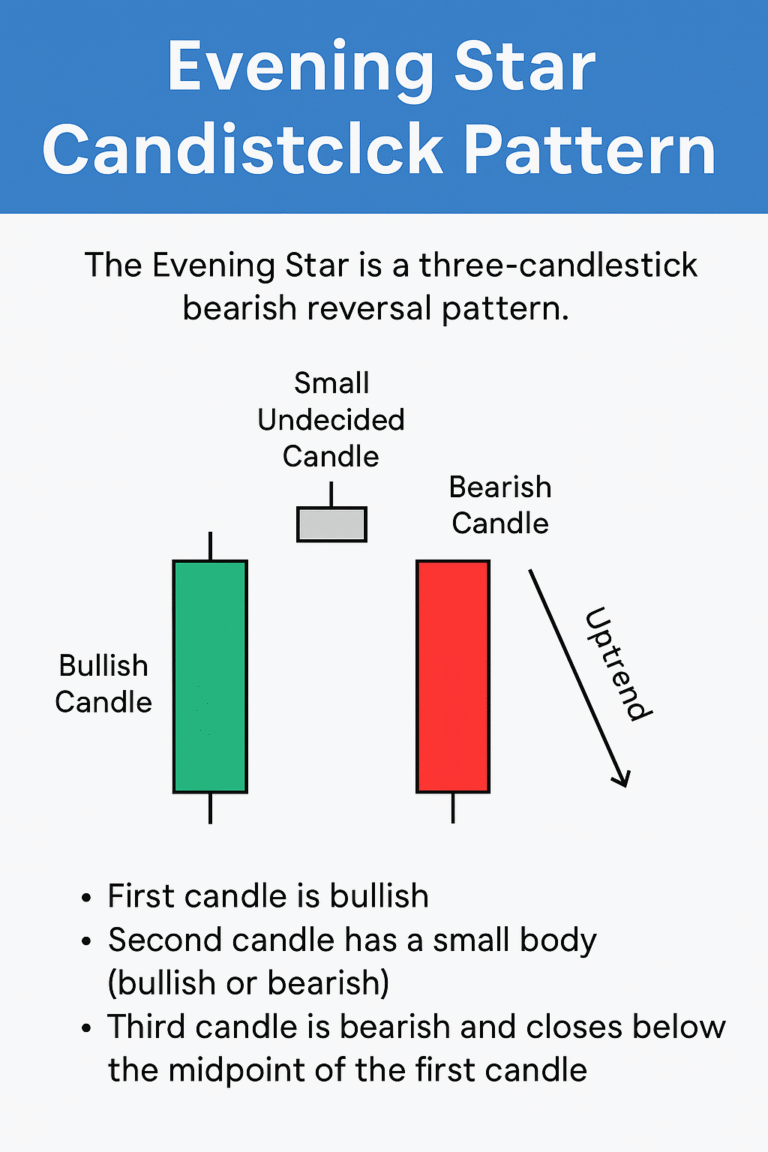
5. What is the opposite of the Morning Star pattern?
The Evening Star pattern, which indicates a bearish reversal after an uptrend.