bearish engulfing pattern

Bearish Engulfing Pattern: Signals and Examples

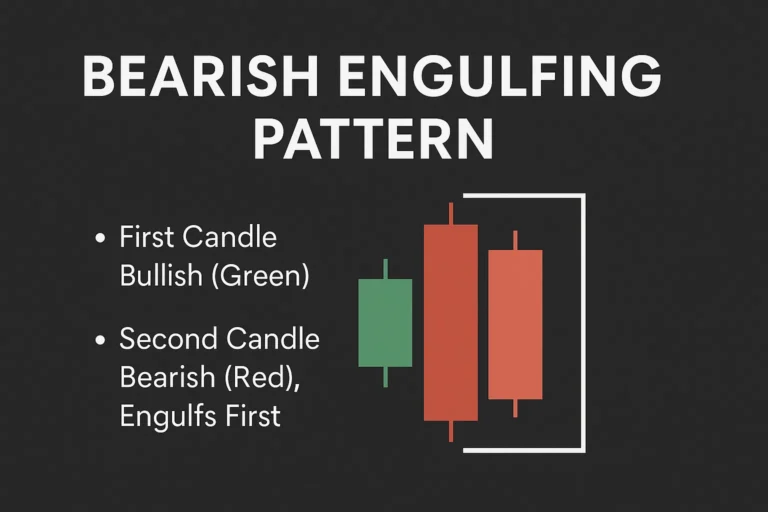
The Bearish Engulfing pattern is one of the most recognized candlestick signals for spotting potential market reversals at the top of an uptrend. This simple two-candle formation reveals a shift in sentiment from buyers to sellers—and it often triggers powerful downward moves when confirmed with other signals. In this guide, we’ll break down the Bearish…

bullish engulfing pattern

Bullish Engulfing Pattern: How to Trade It

The Bullish Engulfing pattern is a popular and powerful candlestick signal that often indicates a trend reversal from bearish to bullish. It’s simple to spot and highly effective—especially when paired with trend context, support levels, or volume confirmation. In this post, you’ll learn what the Bullish Engulfing pattern is, how it forms, and the best…

spinning top candlestick

Spinning Top Candlestick: Sign of Market Indecision

The Spinning Top candlestick pattern is a neutral formation that reflects market indecision. It can appear at the end of an uptrend, downtrend, or even in consolidation zones, often acting as a pause signal for traders watching momentum shifts. In this guide, you’ll learn how to identify the Spinning Top candlestick, what it tells you…

doji candlestick pattern

Doji Candlestick Pattern: What It Signals in Trading

The Doji candlestick pattern is one of the most important signals in technical analysis. It represents a moment of indecision in the market—when buyers and sellers are evenly matched and price closes very near to where it opened. Although simple in appearance, the Doji is powerful when used in the right context. In this guide,…

shooting star candlestick

Shooting Star Candlestick: How to Identify Trend Reversals

The Shooting Star candlestick is a powerful single-candle reversal pattern that often appears near the top of an uptrend. It signals that buyers may be losing momentum and a bearish reversal could be imminent. In this article, we’ll show you how to identify a Shooting Star candlestick, what it tells you about market sentiment, and…

Hammer Candlestick Pattern

Hammer Candlestick Pattern: Meaning, Setup, and Example

The Hammer candlestick pattern is a popular bullish reversal signal used by traders to spot potential bottoms after a price decline. It’s a single-candle formation that suggests a shift in momentum from sellers to buyers. In this guide, we’ll explain how to identify the Hammer pattern, its psychological meaning, and how to use it to…

bullish vs bearish candlestick

Bullish vs Bearish Candlestick Patterns

Candlestick patterns are essential tools in technical analysis, helping traders anticipate market movements. But to use them effectively, you must first understand the difference between bullish and bearish candlestick patterns. In this beginner-friendly guide, we’ll explore what makes a pattern bullish or bearish, how to identify them, and when to use them for smarter trade…

parts of a candlestick

Parts of a Candlestick: Body, Wick, and Shadow

To master candlestick patterns, you first need to understand their basic structure. Each candlestick isn’t just a shape—it’s a story of price action told through three main parts: the body, wick, and shadow. In this beginner-friendly guide, we’ll break down the anatomy of a candlestick, what each part means, and how to interpret them correctly….

What Are Candlestick Patterns? A Beginner’s Guide

What Are Candlestick Patterns? A Beginner’s Guide

Candlestick patterns are among the most popular tools used in technical analysis. They help traders visually interpret price action and understand the ongoing battle between buyers and sellers. Whether you’re trading stocks, forex, or crypto, learning candlestick patterns is a foundational skill for smart decision-making. This beginner’s guide will help you understand what candlestick patterns…

read candlestick chart

How to Read a Candlestick Chart: Step-by-Step

Candlestick charts are one of the most powerful tools in technical analysis. Whether you’re trading stocks, forex, or crypto, understanding how to read candlestick charts can give you insights into market sentiment, price momentum, and potential reversals. In this guide, we’ll break down candlestick charts in a beginner-friendly way so you can start analyzing markets…