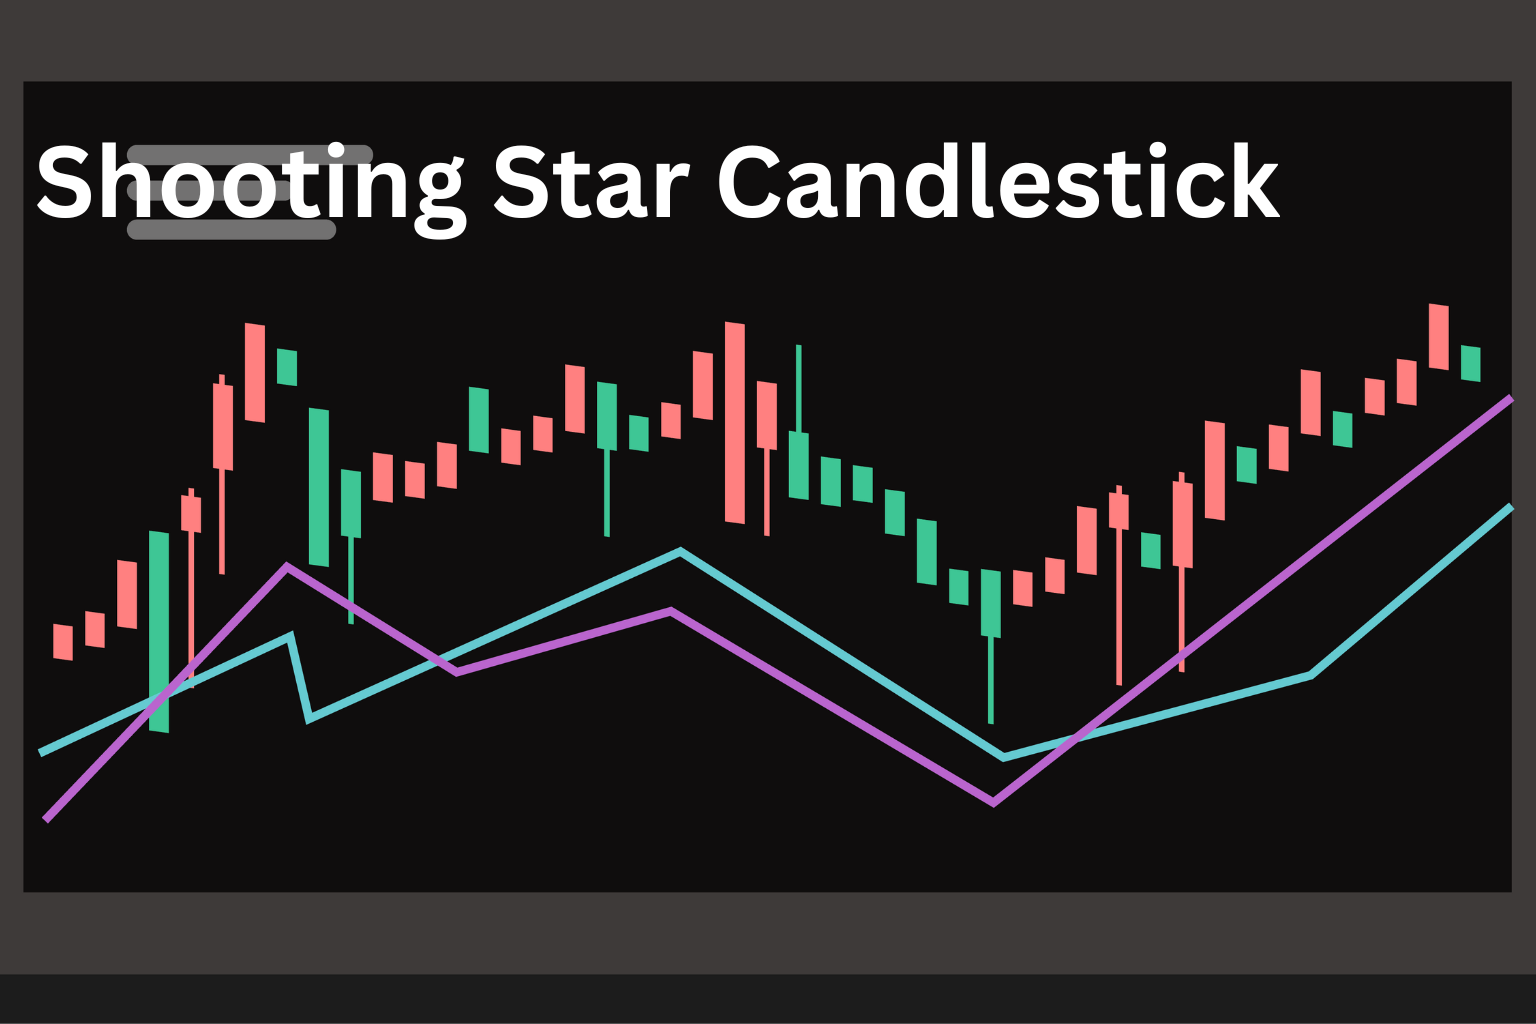
Shooting Star Candlestick: How to Identify Trend Reversals
The Shooting Star candlestick is a powerful single-candle reversal pattern that often appears near the top of an uptrend. It signals that buyers may be losing momentum and a bearish reversal could be imminent.
In this article, we’ll show you how to identify a Shooting Star candlestick, what it tells you about market sentiment, and how to use it in your trading strategy.
What Is a Shooting Star Candlestick?
A Shooting Star is a bearish reversal pattern formed by a single candlestick. It typically appears after a price rally and looks like an inverted hammer or upside-down “T”.
Key Characteristics:
- Small real body near the candle’s low
- Long upper wick, at least twice the size of the body
- Little or no lower wick
- Forms after an uptrend or bullish swing
This pattern reflects a failed attempt by buyers to push the price higher, followed by strong selling pressure.
What Does the Shooting Star Signal?
The Shooting Star shows that the market tried to continue upward—but sellers stepped in aggressively to drive prices back down. This leaves a long upper wick and a close near the session’s low.
It signals:
- Buyer exhaustion
- Potential reversal at resistance
- Opportunity for short entry if confirmed
Shooting Star vs Inverted Hammer
| Feature | Shooting Star | Inverted Hammer |
|---|---|---|
| Appears After | Uptrend | Downtrend |
| Sentiment | Bearish Reversal | Bullish Reversal |
| Confirmation | Red candle next | Green candle next |
How to Identify a Shooting Star Candlestick
- Appears after a price uptrend
- Small body near the low of the candle
- Long upper shadow (usually 2x or more the size of the body)
- No or small lower shadow
- Look for confirmation on the next candle
Trading the Shooting Star Pattern
✅ Entry:
- Wait for confirmation: A strong bearish candle closing below the Shooting Star’s low
- Conservative traders may wait for a break below support or a pullback for a better entry
✅ Stop Loss:
- Place SL above the high of the Shooting Star candle
- This limits risk if the market invalidates the pattern
✅ Target:
- Nearby support levels or previous swing lows
- Use risk-reward ratio (1:2 or better)
Ideal Conditions for Accuracy
- Appears near resistance levels or supply zones
- Accompanied by overbought RSI or divergence
- High volume during the Shooting Star adds strength
- Works best on 4H and daily timeframes
Common Mistakes to Avoid
- Trading the pattern without confirmation
- Ignoring market structure or trend
- Confusing it with the Inverted Hammer
- Using it in a sideways market with no clear trend
Example Scenario
Imagine a stock rallies for several sessions and approaches a known resistance. A Shooting Star forms with a long upper wick and small body. The next day, a red candle confirms rejection.
→ This is a prime short setup, especially if volume spikes.
Conclusion
The Shooting Star candlestick is a key reversal signal for spotting the end of bullish trends. While it’s not always 100% accurate on its own, when paired with confirmation candles, resistance zones, and volume analysis, it becomes a high-confidence bearish setup.
Use it wisely and always manage your risk.
FAQs
1. Is the Shooting Star a reliable reversal signal?
Yes, especially when confirmed by a bearish candle and supported by resistance or overbought conditions.
2. Can it appear on any timeframe?
Yes, but it’s more reliable on 4H and daily charts.
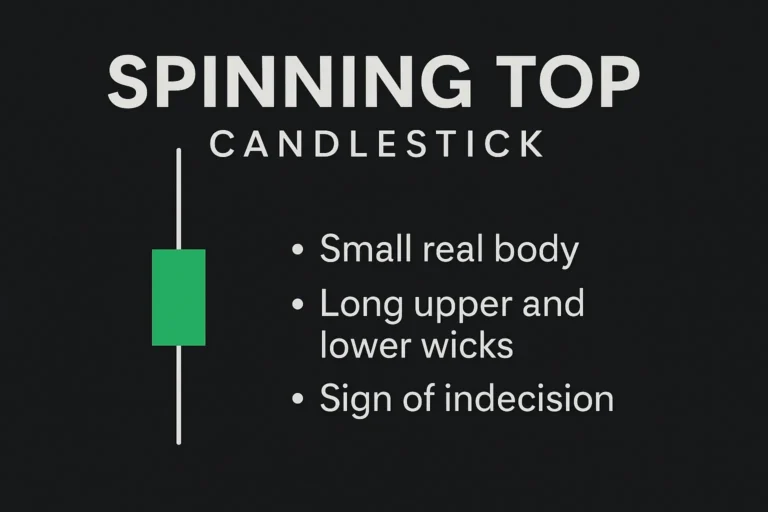
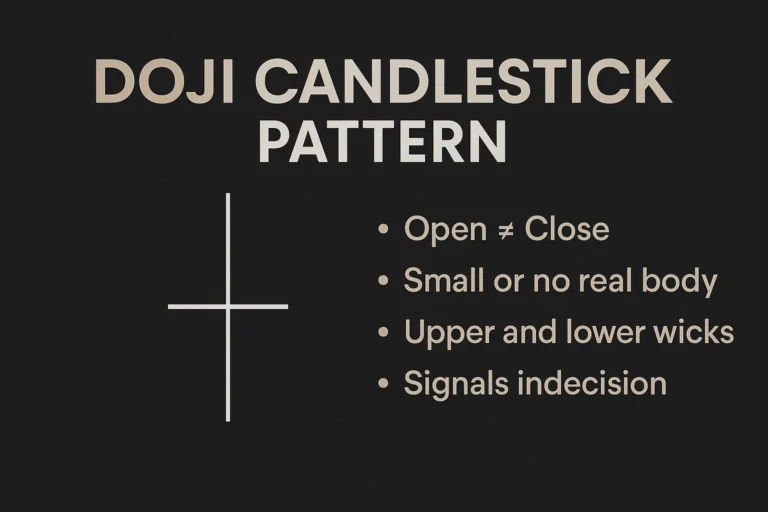
3. What’s the difference between a Shooting Star and a Doji?
The Shooting Star has a defined body and long upper wick; a Doji has almost no body and signals indecision.
4. Can I use indicators with the Shooting Star?
Yes. RSI, MACD, and volume help confirm the pattern’s validity.
5. Is the Shooting Star pattern valid in crypto or forex?
Absolutely. It works across all liquid markets—stocks, forex, crypto, and futures.