Spinning Top Candlestick: Sign of Market Indecision
The Spinning Top candlestick pattern is a neutral formation that reflects market indecision. It can appear at the end of an uptrend, downtrend, or even in consolidation zones, often acting as a pause signal for traders watching momentum shifts.
In this guide, you’ll learn how to identify the Spinning Top candlestick, what it tells you about market psychology, and how to use it in your trading strategy.
What Is a Spinning Top Candlestick?
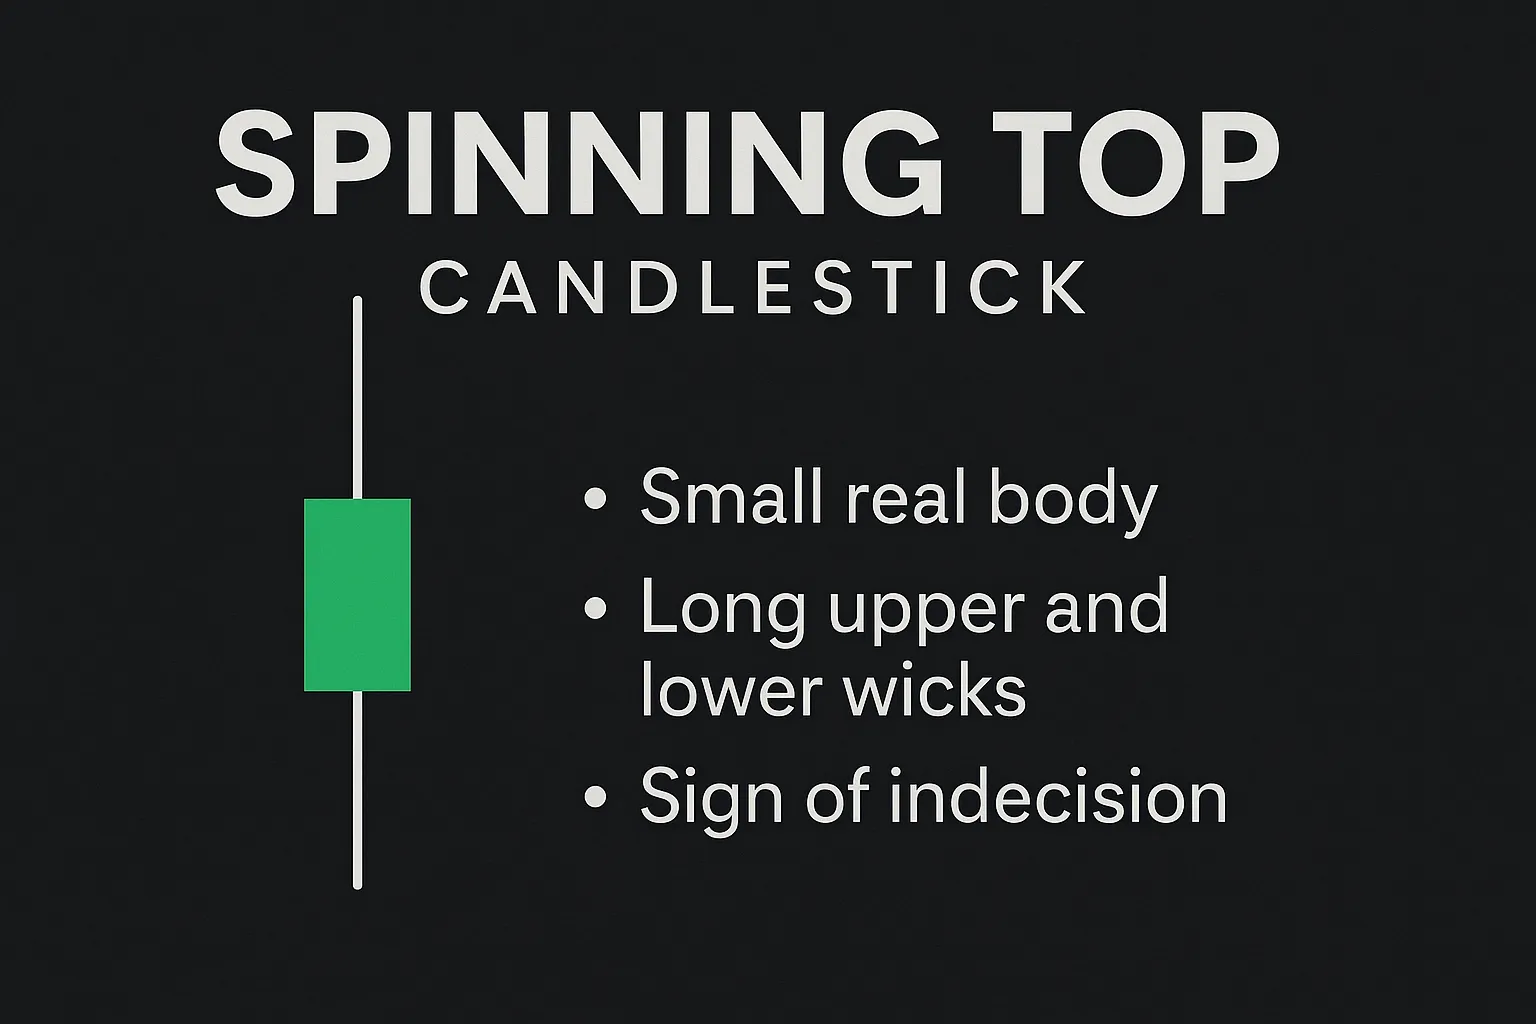
A Spinning Top is a single candlestick with:
- A small real body
- Long upper and lower shadows (wicks)
- Appears after strong trends or within consolidations
The pattern shows that buyers and sellers were active, but neither could dominate — the price closed near its opening level.
This results in a candle that “spins” between bulls and bears, often preceding a reversal or continuation based on what follows.
Key Characteristics of a Spinning Top
- Open ≈ Close (small body)
- Long upper and lower wicks
- Signals uncertainty or a potential pause in price direction
- Can be bullish or bearish, depending on the trend context
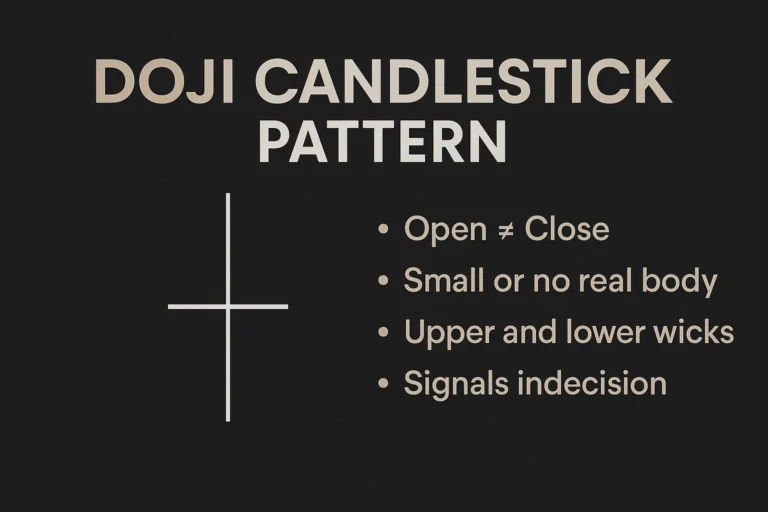
Spinning Top vs Doji
| Feature | Spinning Top | Doji |
|---|---|---|
| Real Body | Small | Almost none |
| Signal Strength | Moderate indecision | Strong indecision |
| Frequency | More common | Less common |
| Interpretation | Neutral | More reversal-prone |
What Does the Spinning Top Indicate?
The Spinning Top reflects a balance between buyers and sellers. The market moves significantly both up and down, but finishes near where it started.
Interpretation Depends on Context:
- In an uptrend: Could signal slowing momentum or potential reversal
- In a downtrend: Suggests selling pressure may be fading
- In sideways markets: Confirms ongoing consolidation
How to Trade the Spinning Top Pattern
✅ Don’t trade it in isolation.
Always wait for confirmation from the next candlestick.
✅ Bullish Scenario:
- Spinning Top at support
- Followed by a strong green candle
- Consider long entry
✅ Bearish Scenario:
- Spinning Top at resistance
- Followed by a strong red candle
- Consider short entry
✅ Stop Loss:
- Place SL below the low (for long trades) or above the high (for shorts) of the Spinning Top
Example Setup
Imagine a downtrend slowing at a key support level. A Spinning Top forms, followed by a bullish engulfing candle.
✅ This setup may signal a reversal — a good opportunity to enter long with a stop below support.
When the Spinning Top Is Most Reliable
- Appears at key price levels (support/resistance)
- Confirmed with volume spike
- Part of a larger reversal pattern
- Supported by RSI or MACD divergence
Common Mistakes to Avoid
- Trading the pattern without confirmation
- Using it in isolation without trend or structure context
- Assuming it always signals a reversal — it may also mean continuation after a pause
Conclusion
The Spinning Top candlestick pattern is a useful tool for spotting indecision in the market. While it doesn’t guarantee a reversal or breakout, it warns traders that the current trend is losing momentum.
Combine the Spinning Top with confirmation signals, key levels, and technical indicators to boost your trade accuracy.
FAQs
1. Is a Spinning Top bullish or bearish?
Neither by default — it’s neutral. Context and confirmation determine direction.
2. What timeframe works best for this pattern?
It appears on all timeframes, but is more meaningful on 4H and daily charts.
3. How is it different from a Doji?
A Doji has almost no body, while a Spinning Top has a small but visible body.
4. Can it be used for crypto or forex?
Yes. It works in all liquid markets—stocks, crypto, forex, and futures.
5. Should I use it alone?
No. Always wait for confirmation and align it with trend, volume, or indicators.