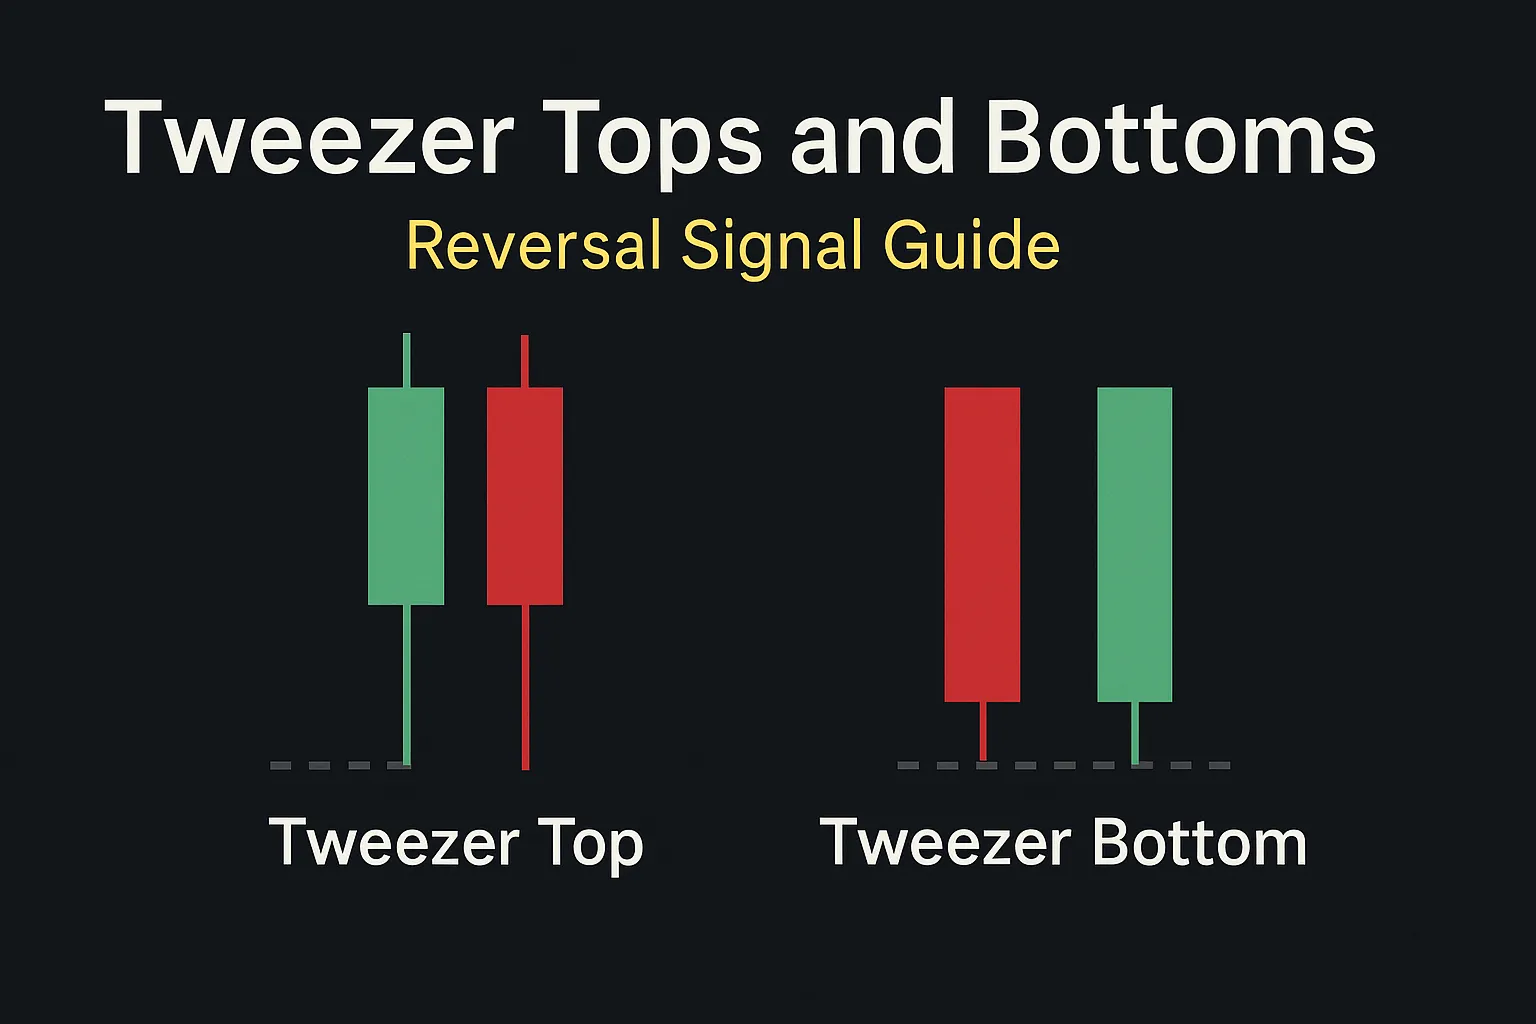
Tweezer Tops and Bottoms: Reversal Signal Guide
The Tweezer Tops and Bottoms candlestick patterns are simple yet effective reversal signals that appear at the end of trends. Recognizing them early can help you spot potential market turning points before they fully unfold.
In this guide, we’ll break down how these patterns form, what they signal, and how to trade them with precision.
What Are Tweezer Tops and Bottoms?
Tweezer Tops and Tweezer Bottoms are dual-candle reversal patterns where the highs or lows of two consecutive candles are nearly equal. This pattern reflects a rejection of price at a key level, often followed by a reversal.
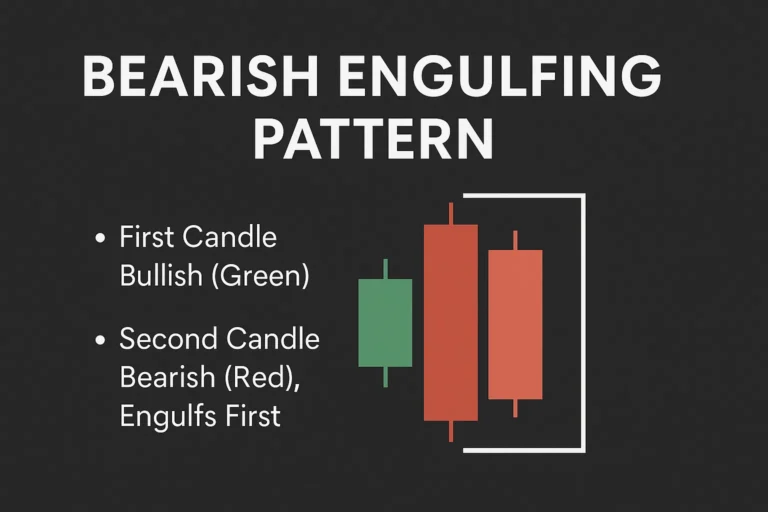
🔹 Tweezer Tops (Bearish Reversal)
- Appears at the end of an uptrend
- The first candle is bullish, the second is bearish
- Both candles have similar highs (wicks nearly equal)
- Signals that buyers tried to push higher but failed—sellers are taking over
🔹 Tweezer Bottoms (Bullish Reversal)
- Appears at the end of a downtrend
- The first candle is bearish, the second is bullish
- Both candles have similar lows (wicks nearly equal)
- Indicates price rejection at the bottom—buyers may regain control
Visual Structure
| Pattern | Candle 1 | Candle 2 | Reversal Type |
|---|---|---|---|
| Tweezer Top | Bullish | Bearish | Bearish Reversal |
| Tweezer Bottom | Bearish | Bullish | Bullish Reversal |
Psychology Behind the Pattern
Tweezer Tops:
- Day 1: Bulls are in control and push prices higher.
- Day 2: Buyers try again but hit the same resistance. Sellers step in, forming a bearish candle.
- Sentiment shifts from optimism to hesitation, then to selling.
Tweezer Bottoms:
- Day 1: Bears dominate, pushing the price down.
- Day 2: Sellers try again but are met with strong support. Buyers push the price up.
- Sentiment shifts from panic to relief, then to buying interest.
How to Trade Tweezer Tops and Bottoms
✅ Entry:
- Enter short after a Tweezer Top confirms with a bearish close
- Enter long after a Tweezer Bottom confirms with a bullish close
✅ Stop Loss:
- Place the SL above the tweezer top wick or below the tweezer bottom wick
✅ Take Profit:
- Target nearby support/resistance zones
- Use a 1:2 risk-reward ratio or trailing stop strategy
Tips for More Reliable Setups
- Combine with support and resistance
- Confirm with volume: strong reversals should have noticeable volume
- Align with RSI or MACD divergence for extra confidence
- Use in strong trends or after exhaustion moves
Common Mistakes to Avoid
- Trading Tweezer patterns without trend context
- Ignoring candle size and wick precision
- Overlooking confirmation from the second candle
- Forcing trades in sideways markets
Real Chart Example
Imagine a stock in an uptrend approaches resistance. A green candle forms, followed by a red candle with an equal high — this is a classic Tweezer Top. With declining volume and an overbought RSI, this setup hints at a coming reversal.
Conclusion
Tweezer Tops and Bottoms may look simple, but they hold powerful psychological clues. When spotted near key levels and confirmed with volume or indicators, they provide a strong edge for reversal trading.
Add them to your candlestick pattern playbook for better timing and cleaner entries.
FAQs
1. Are Tweezer Tops and Bottoms reliable on all timeframes?
They are more reliable on 1H, 4H, and daily charts, especially when near support or resistance.
2. Do the wicks have to be exactly equal?
No, they should be very close, ideally within a few points/pips depending on the asset.
3. Can I trade Tweezer patterns alone?
You can, but confirmation with structure or volume increases success rate.
4. What indicators pair well with these patterns?
RSI (for overbought/oversold) and MACD (for trend shift confirmation).
5. Can Tweezer patterns fail?
Yes. Like any pattern, they’re not 100% accurate. Use risk management and always look at context.