What Are Candlestick Patterns? A Beginner’s Guide
Candlestick patterns are among the most popular tools used in technical analysis. They help traders visually interpret price action and understand the ongoing battle between buyers and sellers. Whether you’re trading stocks, forex, or crypto, learning candlestick patterns is a foundational skill for smart decision-making.
This beginner’s guide will help you understand what candlestick patterns are, how they work, and how to use them to analyze charts effectively.
What Is a Candlestick?
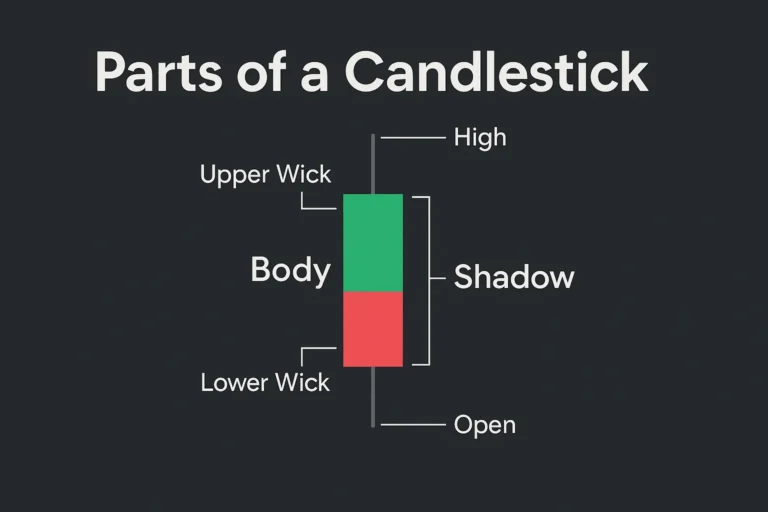
A candlestick is a visual representation of price movement over a specific time period (like 5 minutes, 1 hour, or 1 day). Each candlestick tells you four key things:
- Open: Price at the start of the time period
- High: Highest price reached
- Low: Lowest price reached
- Close: Price at the end of the time period
Candlestick Anatomy:
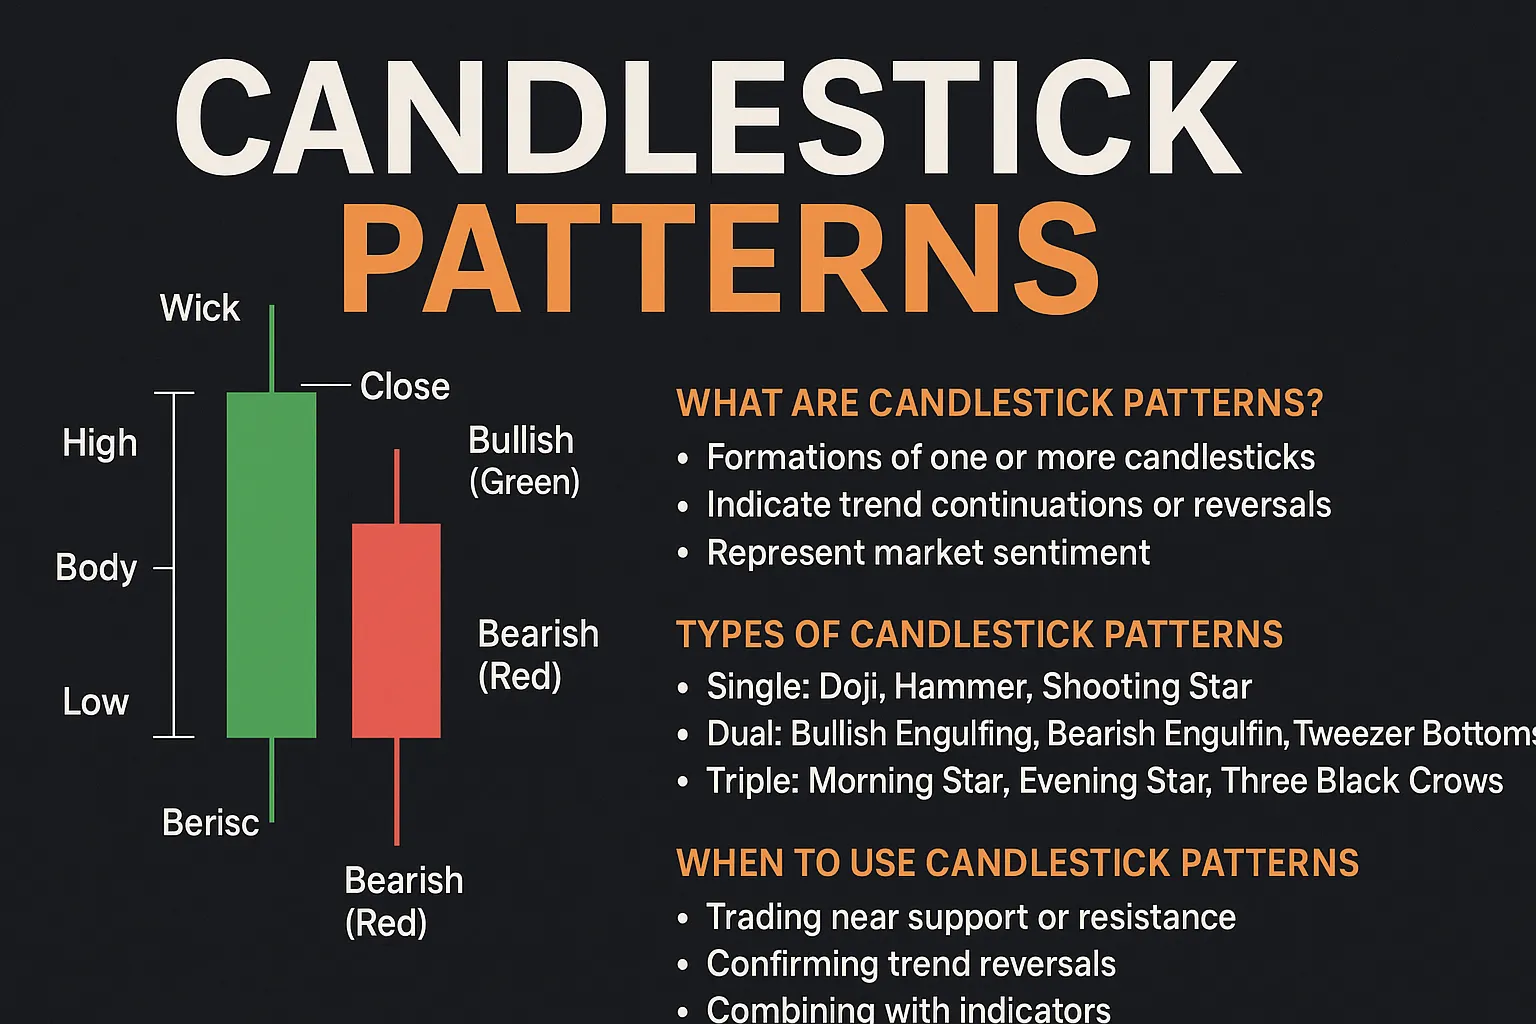
- Body: Area between open and close
- Wick/Shadow: Lines above and below the body (highs and lows)
- Color:
- Green/Bullish = Close > Open
- Red/Bearish = Close < Open
What Are Candlestick Patterns?
Candlestick patterns are specific formations created by one or more candlesticks on a chart. These formations indicate potential trend continuations or reversals, depending on where and how they appear.
They are used to read market psychology—who is in control, bulls or bears—and when a possible shift might occur.
Why Are Candlestick Patterns Important?
- Easy to recognize visually
- Work across all timeframes and markets
- Offer quick insights into price sentiment
- Help traders make better entry and exit decisions
- Can be combined with support/resistance, indicators, and volume
Types of Candlestick Patterns
Candlestick patterns are typically grouped into:
🔹 Single Candlestick Patterns
- Doji: Signals indecision
- Hammer: Bullish reversal at support
- Shooting Star: Bearish reversal at resistance
🔹 Dual Candlestick Patterns
- Bullish Engulfing: Strong upward reversal
- Bearish Engulfing: Strong downward reversal
- Tweezer Tops and Bottoms: Reversal indicators
🔹 Triple Candlestick Patterns
- Morning Star: Bullish reversal pattern
- Evening Star: Bearish reversal pattern
- Three White Soldiers / Three Black Crows: Trend strength indicators
When to Use Candlestick Patterns
Candlestick patterns are best used when:
- Trading near support or resistance zones
- Looking for trend reversal confirmation
- Combining with indicators like RSI, MACD
- Trading breakouts or retests
- Analyzing volume shifts in momentum
Limitations of Candlestick Patterns
While helpful, candlestick patterns aren’t foolproof.
- Can produce false signals in ranging markets
- Work best when combined with trend context
- Require confirmation candles or other tools
- Should not be traded in isolation
How to Start Using Candlestick Patterns
- Learn to recognize basic patterns visually
- Apply them to charts on your platform (like TradingView)
- Combine with other tools for confirmation
- Practice on historical charts before going live
- Keep a journal to track which patterns work best for you
Conclusion
Candlestick patterns are a powerful way to understand market sentiment and anticipate price movements. While simple in structure, they reveal deep insights into crowd psychology—something every trader should pay attention to.
Mastering candlestick basics is the first step to becoming a more confident, technically aware trader.
FAQs
1. Are candlestick patterns accurate?
They can be effective when used with confirmation and in the right context. No pattern is 100% accurate.
2. Can beginners use candlestick patterns?
Yes, they’re ideal for beginners because they’re visual and easy to understand.
3. Which timeframes work best for candlestick patterns?
Daily and 4H charts offer better signals, but they can be used on any timeframe.
4. Can I use candlestick patterns in crypto or forex?
Absolutely. They work across all financial markets.
5. Do I need any indicators with candlestick patterns?
Not required, but indicators like RSI and MACD can strengthen your analysis.